Market is taking a break
The market has been correcting since the previous peak. Although BTC/USD broke out yesterday from the falling wedge, the price is throwing back as the buying volume wasn't enough as discussed yesterday.
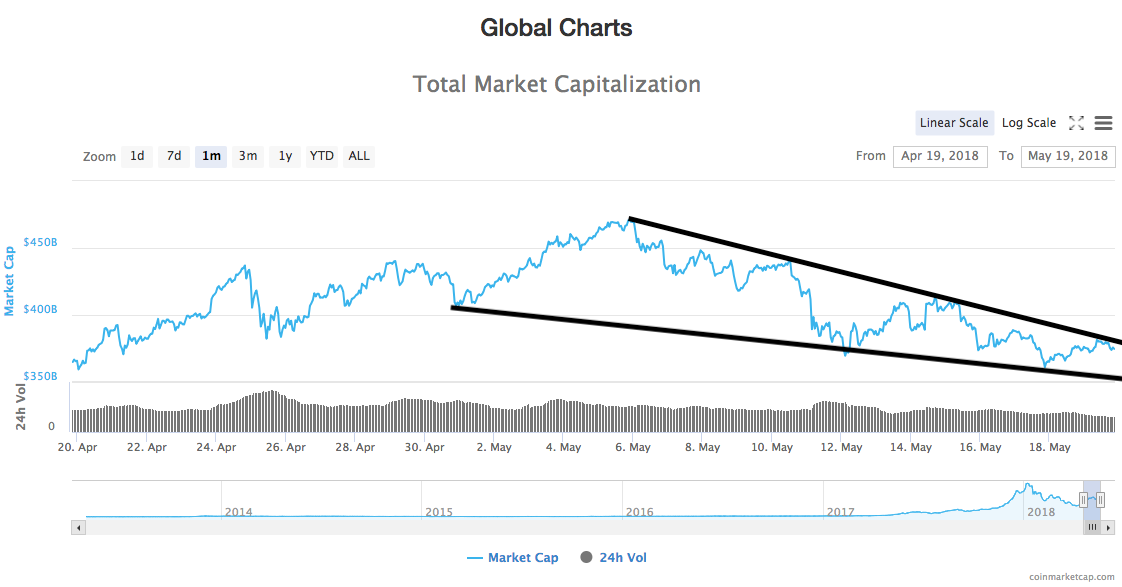
Falling wedge in the global market chart
This may be explained by a falling wedge formation in the global chart. The chart below shows the total market cap of the cryptocurrency including both bitcoin and altcoins. As you can see, the chart is forming a falling wedge, which is a bullish continuation and consolidation pattern. The volume usually decreases during the pattern formation and no exception here.

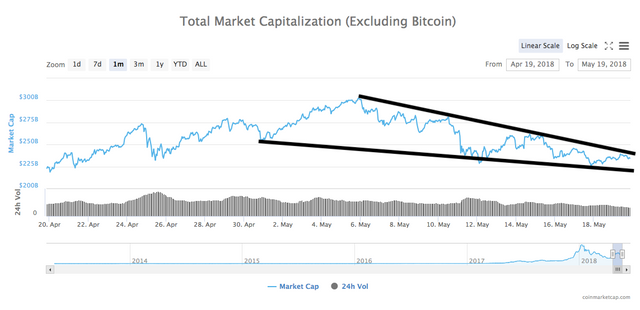
Falling wedge in the altcoin global chart
The chart below looks the same as the previous chart but the market cap doesn't include bitcoin, that is, the chart below only includes altcoins. This chart is also forming a falling wedge pattern.

Need some catalysts
The falling wedge pattern is usually bullish but the market is waiting for some catalysts to break out or down from the falling wedge. This could be bitcoin ETF, Ethereum future, or any kind of big fundamentally bad/good news.
Please upvote and follow me if you like the post.
Where I trade : Binance
Follow me on Twitter : Twitter
Disclaimer : I am not a certified financial advisor. This post is just my personal opinion and not financial advice. Please do your own research and do not trade just based on my posts.