Verge (XVG) Technical Analysis - 07/07/2018
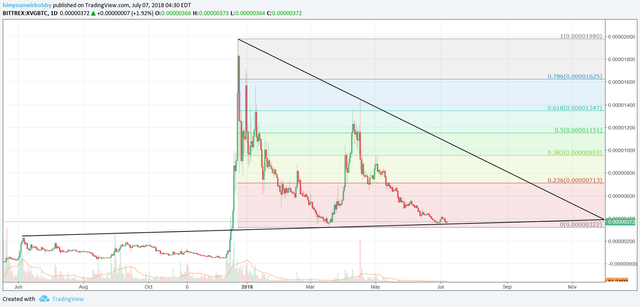
Verge (XVG) is showing a lot of signs that it might be due for a reversal very soon. Here is a quick look at what XVG/BTC is showing us on the daily chart.
Daily Chart:
XVG is currently contained within this very large descending triangle. It has held support on an historical price action line that goes all the way back to June of 2017.
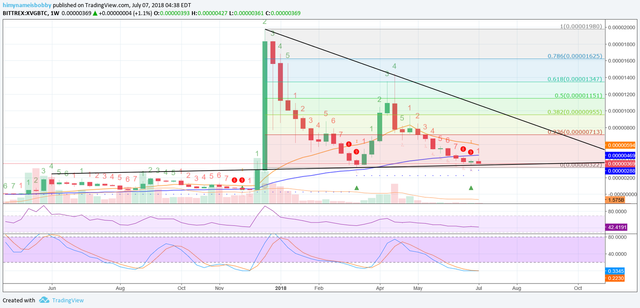
Let's take a look at the Weekly chart, this time using a few indicators.
Weekly Chart:
XVG finished printing a perfect 8 and 9 count based the TD Sequential indicator. The RSI is sitting above 42, which has historical been a strong point of support. The MACD is both bottomed out, and is beginning to cross over.
Potential Trade Setup:
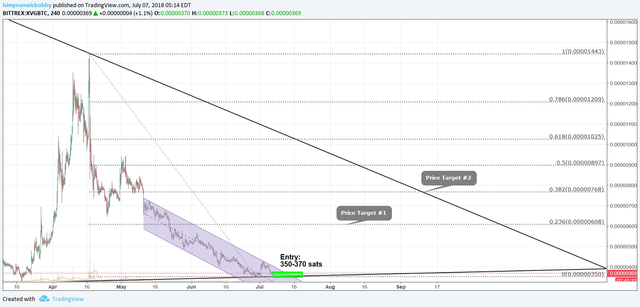
I will be looking to scale in between 350-370 sats. A stop-loss of between 5-15% is recommended, depending on your risk tolerance. The shorter term prices I am targeting are the fib levels listed above.
Thanks for your time! Let me know if you liked this and want me to do more :D
#cryptocurrency Coin recommendations are also a possibility if that's what anyone wants.
Thanks all!
Neeko
Legal Disclaimer:
I am not a #crypto financial advisor and this is not financial advice. Please invest based on your own discretion and knowledge.