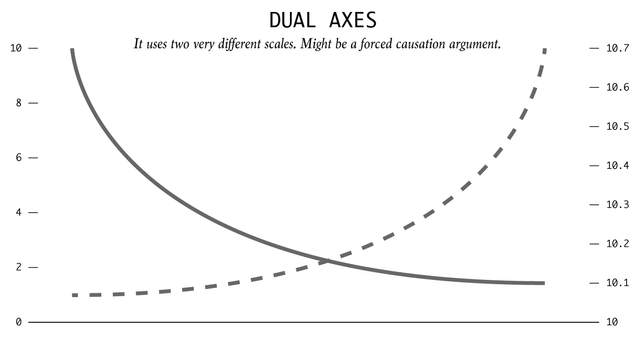
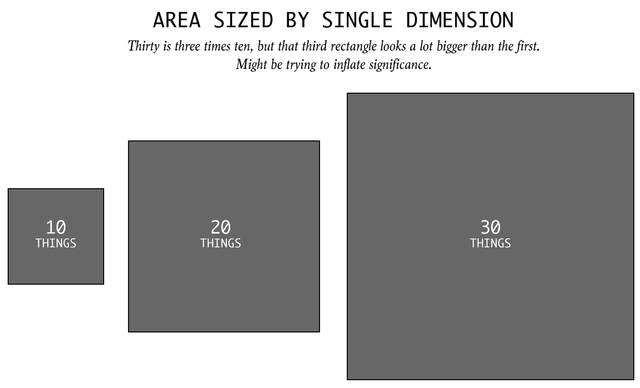
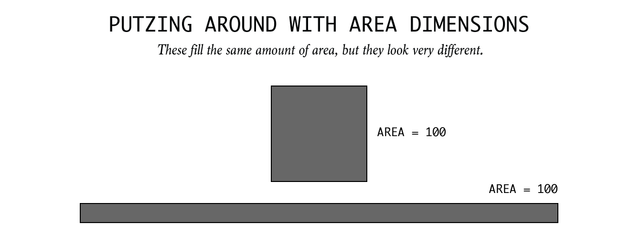
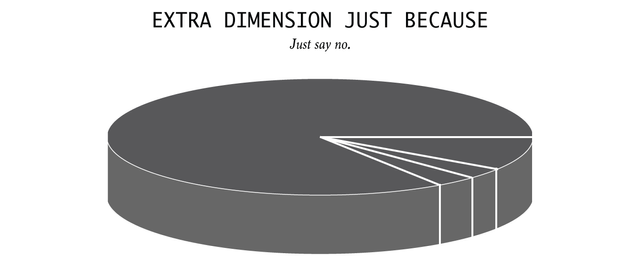
My favourite 101 collection on how to see through data visualisation trickery, thereby giving you a good set of "rules of thumb" to look at data properly. If you're really into it, there's an oldie, but goody book called "How to Lie with Statistics". https://en.wikipedia.org/wiki/How_to_Lie_with_Statistics
Credits for this fun walkthrough go to Nathan Yau of FlowingData.


Full article: https://flowingdata.com/2017/02/09/how-to-spot-visualization-lies/
Great examples. Are these ones that you produced?
Downvoting a post can decrease pending rewards and make it less visible. Common reasons:
Submit
No I haven't made them, but for everyone who enjoys looking at data, or even just reading the news - this is a must! Source: https://flowingdata.com/2017/02/09/how-to-spot-visualization-lies/
Downvoting a post can decrease pending rewards and make it less visible. Common reasons:
Submit
very interesting, do you think these tricks apply to the cryptocurrency charts as well? would maybe significant for the traders
Downvoting a post can decrease pending rewards and make it less visible. Common reasons:
Submit
I have seen plenty of y-axis manipulation on crypto price and return graphs to stimulate FOMO and get people buying.
Downvoting a post can decrease pending rewards and make it less visible. Common reasons:
Submit
Absolutely! I've seen a lot of tomfoolery in the crypto world. Particularly among how newer ICOs like to report their early successes in the market. They're just using the same old tricks as you can see above usually. I'll send you one if I come across something :D
Downvoting a post can decrease pending rewards and make it less visible. Common reasons:
Submit
Oh my. Literally the things I learned/taught in my Information Visualization class. I brought this up in your intro post!
The biggest rule of thumb my professor taught us was Never Use Pie-charts unless there aren't a lot of sections and the differences among each is easily noticeable without having to rely on numbers in those sections. One of the most "eye opening" one for me was how people sometime change the scales on the y-axis to make the difference look enormous. So many tricks...
Anyways, thanks for sharing!
Downvoting a post can decrease pending rewards and make it less visible. Common reasons:
Submit
Haha N-E-V-E-R Piecharts. Not even once :)
Totally agree
Downvoting a post can decrease pending rewards and make it less visible. Common reasons:
Submit
I am a huge fan of Edward Tufte and the work he has done to make data visualization honest again. Unfortunately there is very little education around these topics, and I think you can add #steemiteducation or #education tags to these types of posts as well :) I think the #blockchainbi community would enjoy reading this too.
Downvoting a post can decrease pending rewards and make it less visible. Common reasons:
Submit
Thanks for the tips! And yes, Edward Tufte is phenomenal :)
Downvoting a post can decrease pending rewards and make it less visible. Common reasons:
Submit
Glad you think so too... otherwise the conversation might be rather interesting :)
Downvoting a post can decrease pending rewards and make it less visible. Common reasons:
Submit
very nice overview. Also in science, statistic tricks are the most common deception.
@originalworks
Downvoting a post can decrease pending rewards and make it less visible. Common reasons:
Submit
The @OriginalWorks bot has determined this post by @remuslord to be original material and upvoted it!
To call @OriginalWorks, simply reply to any post with @originalworks or !originalworks in your message!
Downvoting a post can decrease pending rewards and make it less visible. Common reasons:
Submit