Data science is a broad field in which scientific methods are used to extract the knowledge and to convert the data in an organized form and to solve analytically complex problems. Data science is not a much easy field to work. A data scientist like other work fields should have proper training and knowledge of data science. To be an ideal candidate for your interview in the field of data science you must be well prepared.

In this article I am going to discuss some of the very important questions that can be asked in a data science interview as below:
What is data science?
Data science is a versatile field that includes scientific methods, processes algorithms to solve complex data related problems. Data science includes the study of various types of data such as structured and unstructured so as to organize the data in structured form. In the field of computing technology data science has evolved very frequently these days.What is the best programming language to be used in data science?
Python and R programming are the two programming languages to be used to handle data science. Python is the best programming language in data science by far. Python is preferred more over R programming as it has the panda’s library that provides easy to use data whereas R programming is for retrieving data.What are the various benefits of R programming?
The R programming has a set of software suite used for statistical computing, graphical representation.
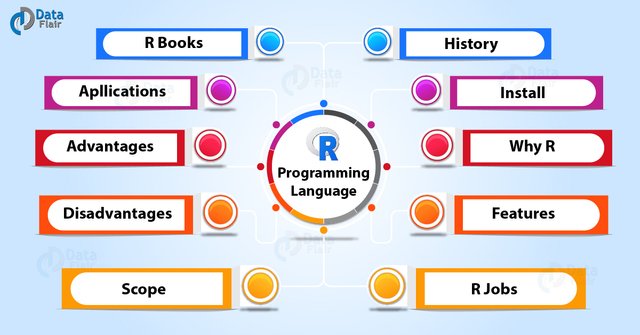
• It is useful in solving data-oriented problems.
• Simple and yet effective programming language.
• Acts as connecting link between various software tools.
How do data scientists use data statistics?
It is the process in which data scientists use raw data to create models and predictions backed up by data. It helps in getting the better idea of what customers are expecting.
- How do you install a package in R?
The command used to install the package in R is:
Install. Packages (“<package_ name>”)
For example:

- How would you create a new R6 class?
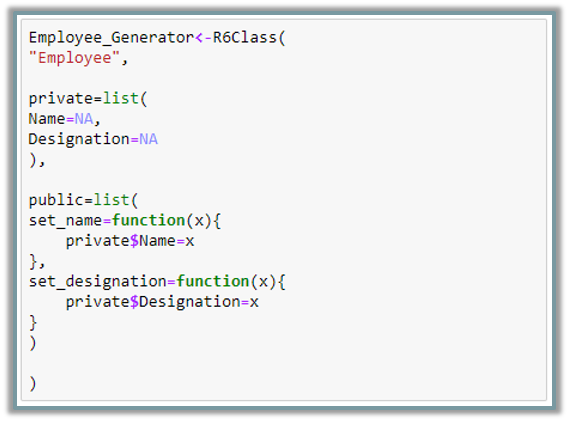
For this first create an object template, which consists of “data members “and class functions present in the class, Parts of an R6 object template:
• Class name
• Private members
• Public member functions
Let’s understand this by an example:
- Give examples of “bind()” and “bind()” functions in R
Cbind (): it is used to bind two columns together. While binding two columns the number of rows in both the columns needs to be same.
For example: here is “marks” data set comprised of marks in three subjects >
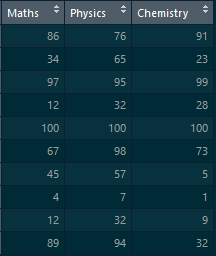
Now bind this with new dataset “percentage” which consists of two
Columns :-> ”Total” and “percentage”

Now combine the columns with two datasets using the “cbind” () functions->
Cbind (marks, percentage)
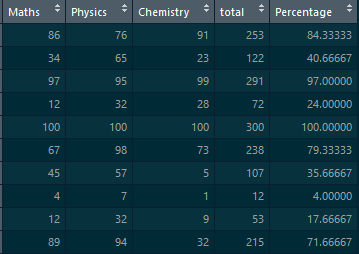
The number of rows in both the datasets is same then combines the columns with the help of “cbind” function.
- How would you create a scatterplot using ggplot 2 plots?
Correlation between two or more entities can be visualized at the same time with the help of a scatter plot.
Let’s take example:
Ggplot (iris,aes(y=sepal.length,x=petal.Length))=geom. point()

What do you understand by term normal distribution?
Data is distributed in different ways with a bias to the left or to the right. But there are chances that data can be distributed normally without any bias in the form of central tendency and reaches normal distribution in the form of a normal bell-shaped curve.How will you define the number of clusters in a clustering algorithm?
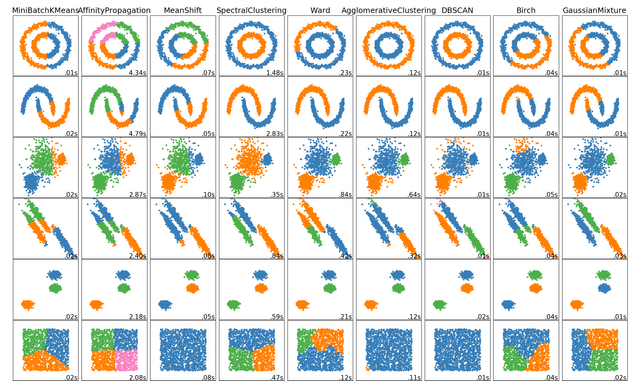
The clustering algorithm is not specified. The objective of clustering is to group similar entities in such a way that the entities within a group are similar to each other but the groups are different.
