A guide on how to with data structures such as Vector, Matrix, Array, Data frame and List in R programming language.
Lets see those data structures one by one:
Vector
It can be defined with the combine function c() in the following way
v1 <- c(1,2,3,4,5)
mode(v1)
The class of the vector v1 is numeric. R console will display [1] "numeric"
By declaring another vector v2 note that it will automatically transform the numbers in characters so that all the elements belong to the same class.
v2<- c(1,2,3,4,"five")
mode(v2)
In fact R console displays : [1] "character"
Matrix
You declare a matrix by the matrix() function and by specifying the number of elements and number of rows and columns
m <- matrix(1:20, 4, 5)
m
[,1] [,2] [,3] [,4] [,5]
[1,] 1 5 9 13 17
[2,] 2 6 10 14 18
[3,] 3 7 11 15 19
[4,] 4 8 12 16 20
You can access a row or a column of the matrix by indicating the number of row or the column. In this example the code provides access to the row 2 and to the column 3 of the matrix m.
m[2,]
[1] 2 6 10 14 18
m[,3]
[1] 9 10 11 12
Array
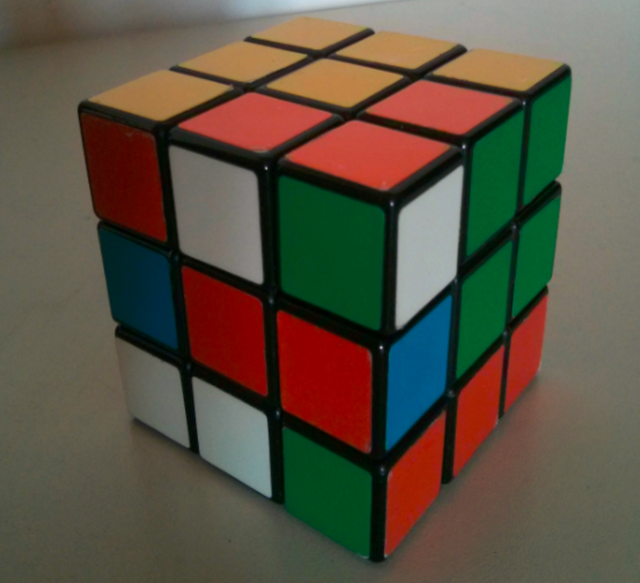
Arrays in R can have more that two dimensions. You can immagine an array as a Rubics cube. In this example the array have three dimensions just like the rubiks cube.

x <- c("A1", "A2", "A3")
y <- c("B1", "B2", "B3")
z <- c("C1", "C2", "C3")
data <- array(1:27, c(3, 3, 3), dimnames=list(x, y, z))
data
The R console will display
C1
B1 B2 B3
A1 1 4 7
A2 2 5 8
A3 3 6 9
C2
B1 B2 B3
A1 10 13 16
A2 11 14 17
A3 12 15 18
C3
B1 B2 B3
A1 19 22 25
A2 20 23 26
A3 21 24 27
Data Frames
The biggest part of data in R are given in a tabular form. Thats why the data frames in R are particularly important and this is an example on how to declare a data frame in R.
In this case R console will display 1 1 25 SoftwareIng A You can access the columns by using the $ operator in the following way. studentdata$course Or like a matrix. In this case you point to the second row of the data frame : studentdata[2,] studentdata[studentdata$age < 30,] studentID age course grades 1 There is also the possibility to add a column to an existing dataframe by using the names attribute as follows : studentdata$names = c("Brian", "Jack", "Bob") In R lists are an ordered collection of objects. Unlike the elements of vectors, list elements or components do not need to be of the same type, mode, or length. The components of a list are always numbered and may also have a name attached to them. Lets see an example of a list: length(data_as_list) It is possible to concatenate the lists using the c() function. In this example we concatenate data_as_list with data_as_list2. data_as_list2 <- list(workerid = 1, workername = "Bob") $studentname $studentmarks $workerid $workername These are the most important data structures in R and it is better go deep with this argument if you want to have a solid knowledge in this fundamental area. This web page was generated automatically by using the R markdown and in particular the knitr R package. If you want to learn more there is datatreemap.com which presents different guides on data visualization.
studentID <- c(1, 2, 3)
age <- c(25, 34, 28)
course <- c("SoftwareIng", "Statistics", "DataScience")
grades <- c("A", "B", "A")
studentdata <- data.frame(studentID, age, course, grades)
studentdata
studentID age course grades
2 2 34 Statistics B
3 3 28 DataScience A
[1] SoftwareIng Statistics DataScience
Levels: DataScience SoftwareIng Statistics
studentID age course grades
2 2 34 Statistics B
You can perform different queries on the data of a data frame for example by taking all the rows that have values above a certain threshold. In this case the students that are less that 30 years old.
1 25 SoftwareIng A
3 28 DataScience ALists
data_as_list <- list(studentid=1,
studentname="Dan",
studentmarks=c(7,10,12,12))
You can check the number of components of a list by using the length() function:
[1] 3
result <- c(data_as_list, data_as_list2)
result
$studentid
[1] 1
[1] "Dan"
[1] 7 10 12 12
[1] 1
[1] "Bob"
@originalworks
Downvoting a post can decrease pending rewards and make it less visible. Common reasons:
Submit
The @OriginalWorks bot has determined this post by @datatreemap to be original material and upvoted it!
To call @OriginalWorks, simply reply to any post with @originalworks or !originalworks in your message!
To enter this post into the daily RESTEEM contest, upvote this comment! The user with the most upvotes on their @OriginalWorks comment will win!
For more information, Click Here! || Click here to participate in the @OriginalWorks sponsored writing contest!
Special thanks to @reggaemuffin for being a supporter! Vote him as a witness to help make Steemit a better place!
Downvoting a post can decrease pending rewards and make it less visible. Common reasons:
Submit