The US economy and markets reached a turning point yesterday. The next two weeks will tell us whether the next long-term move will be into deflation or into inflation. My interpretation of the charts suggests deflation is now more likely. Deflation could be devastating.
Two parts in this report.
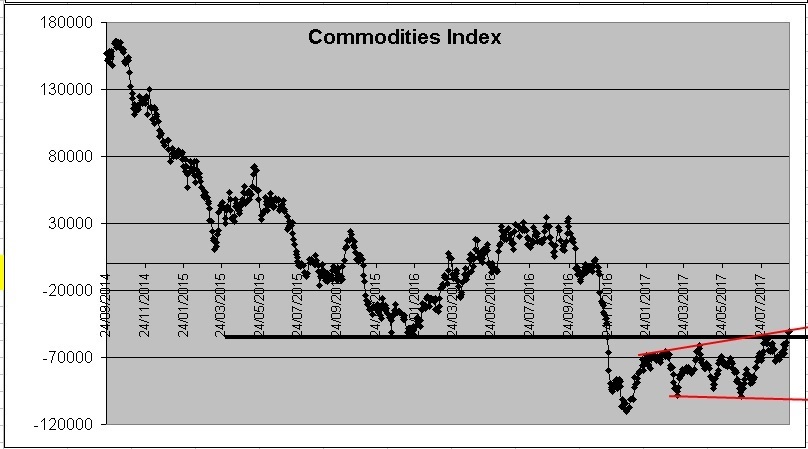
Part 1 - Physical Commodities Index: Chart and Interpretation
This chart worries me because it suggests the possibility (and maybe high probability) that physical commodities will begin a powerful price deflation within the next two weeks.

For those familiar with Elliott Wave Analysis, the pattern since Dec 23, 2016 appears to be a corrective wave apparently completed yesterday. It consists of:
- Sharp simple rally (from Dec 23, 2016), followed by...
- Sharp simple reaction, followed by...
- A 3-3-5 (Flat) corrective wave upwards
Combine the prognostication indicated by this pattern (i.e. imminent trend resumption downwards) with yesterday's resignation of Stanley Fischer, ex-Israeli central banker, Vice-Chair of the Fed, PhD supervisor of both Bernanke and Yellen, effective October - for 'personal reasons', and a few questions come to mind:
Has Fischer successfully completed his assignment to guide Fed policy - or has he failed? Has inflation picked up as he long predicted? Is 3% GDP growth in the US as recently announced indicate his success? If so, then why did he say he resigns for 'personal reasons' instead of saying his assignment was completed successfully?
Have US households reached the point of 'debt saturation' that Fischer sees? Has the debt-driven proclaimed recovery reached its end?
Is Fischer's resignation triggered by what he sees in the big picture: Cost of recovery from the Hurricanes , Trump's policies, Confrontation with North Korea / China? Other?
Does Fischer believe Yellen will not be reappointed next year by Trump to head the Fed, and if he, Fischer, stays he too will be dismissed by Trump - so he better leave gracefully now?
I don't know the answers, so I watch my charts.
If the Commodities index (that so far correctly tracked the overall price trend of physical commodities) begins the next impulsive decline, that will be proof enough for me that the feared price deflation (to be followed by a feared and very strong, or possibly hyper-) inflation would have begun.
We'll get first clues to the answers within the next couple of weeks. Not long to wait.
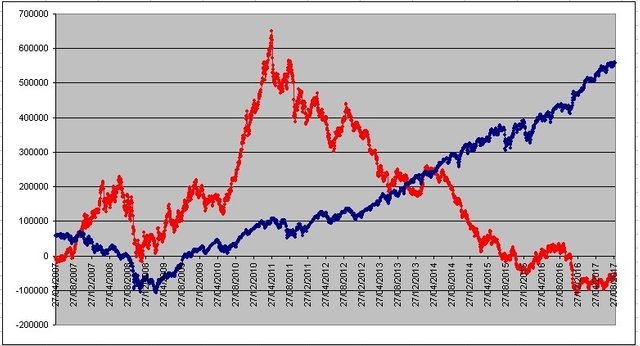
Part 2 - Commodities index vs Financials Index: Chart and Interpretation
Note: Commodities are in Red. Financials in Blue.
Period: August 2007 (from pre-crisis) to date.
This is a daily chart.

The two indices are normalized. That means they are using the same unit of measure (derived from standard deviations, and one is mapped onto the other) and are therefore comparable.
This chart might suggest the possibility that when the Financials index turns and trends downwards, the commodities index might turn in the opposite direction and trend upwards. For now I believe that is not likely unless my reading of the chart in Part 1 is wrong.
The more likely scenario is one in which both indices turn and trend downwards together, beginning within the next two weeks. Price cratering in the financials index would destroy much paper wealth. That would increase the purchasing power of the USD. That in turn would deflate the dollar price of physical commodities. This scenario would lead to perhaps a catastrophic price deflation. Seeing that, the Fed would probably panic and begin massive printing - creating the conditions for high (if not hyper-) inflation. Another factor to keep in mind is that if the USD rises in purchasing power, it is likely that US Dollars now in Europe (i.e. the Euro Dollar) and elsewhere across the world would begin to flow back into the US... exacerbating the inflationary process.
Given the complexities of the current uncertainties all I can do is watch and interpret my charts. Particularly significant would be the direction of a breakout from the sideways wave in commodities chart that began on Dec 23, 2016. (See the top chart). Needless to say, I'll be watching for early clues of a change in direction of the long-term trends in Financials and Physical Commodities. I'll provide the next update as soon as an important insight occurs from my daily analysis.
Welcome to Steemit!
We have all been waiting for you, we are glad you could make it.
I have given you a upvote to help you out!
Hope you love Steemit as much as we do.
Give these a read:
Chat with us:
If this post was helpful, please leave an upvote. It helps me to keep helping new users.
I'm sunnybooster, a booster for accounts not posts. Send me 0.5 STEEM or SBD to get a week of upvotes! If you don't yet know what this is its fine.
I am a bot and this was automated. I exist to help out new members and attempt to get them hooked
Downvoting a post can decrease pending rewards and make it less visible. Common reasons:
Submit