First I would like to start out by saying that this "STEEMit-View" concept was inspired by my b0i @roncriss
I met him on over @TradingView(charting platform) - https://www.tradingview.com
This is where I first started to become social 0nline. I attempted to be social with "Myspace" back in the dayz as they had a tool(audio player) that allowed for us to upload our own music. That was fun!
I'm glad that @roncriss posted pics of some charts recently of some coins he was looking into because it alerted me that this is what I do so why not post on what I do!
@TradingView I rarely post and when I do, It doesn't seem to get published as everyone continues to ask me why I don't post lol
I guess it's an issue that needs to be addressed. I will contact support about the situation@hand. Maybe it's due to me having just a basic account. I did however start out here on @steemit by posting charts of my infamous USD/JPY Forex pair better known as UJ ;) But my Rep/S.P./Followers wasn't strong enuff to motivate me to continue 0n(moving forward;)
So, the idea "STEEMit-View" just hit me as I was writing this. And the reason behind the name is due to me giving more 0f an in-depth personal touch to my analysis. What does this mean you ask, it's me giving you details of what went on as I was observing. @TradingView it's quick to the point, you tell your plan and 0r a quick prediction. IDK it's the same but slightly different as you will notice IF reading my material ;) So with that being said, let's now draw our attention to the charts, my plans, and analysis ;)
FIRST we start 0ut with 'D0PeC0in' - Here is a view of the 30Min-Chart
4rm the 30min view it looks more like a double-t0p situation where it can again, head back down breaking out of the first support area in this Triangle-like shape to then head dWn to the next support around the 400 Sats.
Now let's take a look@the daily-chart!
DAILY CHART VIEW

Don't you just l0ve these Bittrex-charts! This is the main reason for me deciding to start back up my analysis. The charts lk so clean.
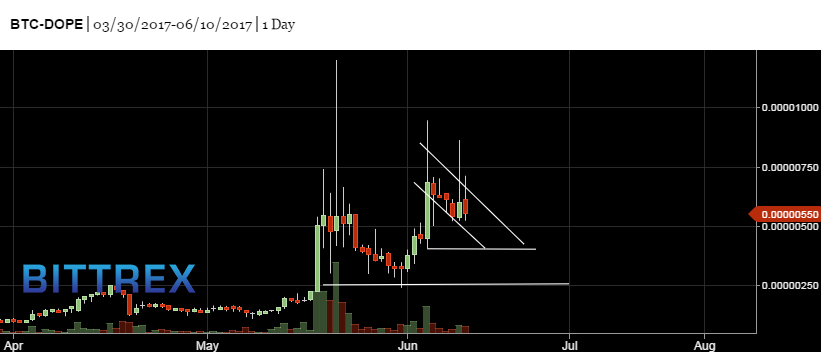
Anyways you can see below on the Daily-Chart we have a 'bull-flag' set-up . It's always a smart idea to pay attention to multiple time frames rather than one to all you new-comers to the game. This is the reason I decided to get into another position@680(yesterday I believe) . I knw it was a bit high to get in but was a bit impatient and I felt movement pushing higher so I wanted to get my feet wet for in case it took 0ff .
Whatever happens, I'll stay in and purchase more later if it drops. I see prices staying above the 500 Sat Level from this point-0f-view. I would like to hear 0r see other views relating to this c0in.
EXACTLY WHAT WENT DWN
I sn D0Pe near the 700's I was going to place TARGET @700 to get out of my position to then get back in around the 500's but something told me it may jus shoot back up to the 800's as it was lookN quite Bullish BUT it U-Turned & so I wait, no problem! I still have my l0ng-term D0PE put to the side so, I can wait all day everyday for the market to go my direction unless I happened to spot another coin going to the moon to then ride that one up ;)
RDD-C0in Analysis Coming Up...
UPDATE_6-12-17

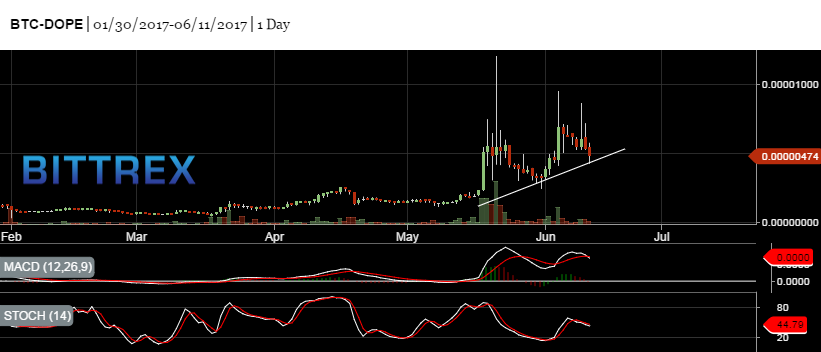
So will it walk the line 0r will we break??
It already dropped below 500 Sats which I did not expect! I will be purchasing up again ;)
Downvoting a post can decrease pending rewards and make it less visible. Common reasons:
Submit
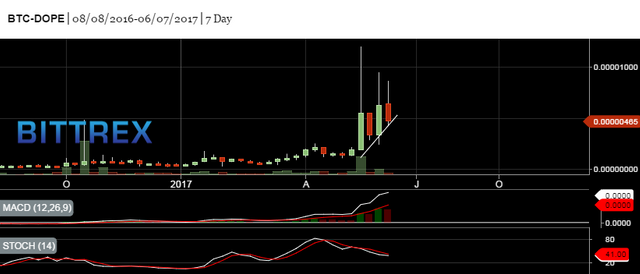
WKly Chart

Seeing Divergence. Still in an uptrend ;)
Downvoting a post can decrease pending rewards and make it less visible. Common reasons:
Submit