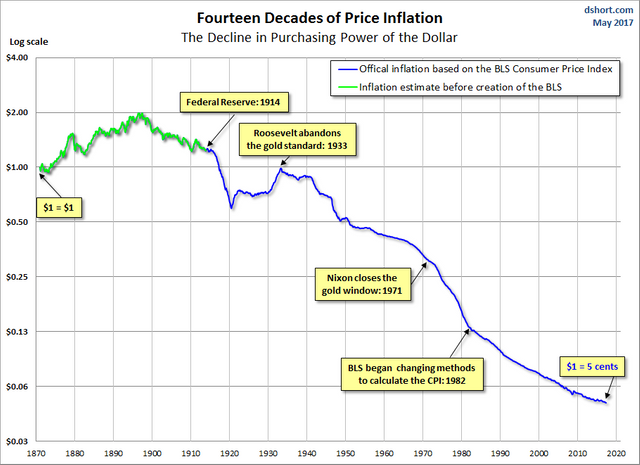
If you're holding onto a particular point of view regarding USD strength, let's put the 'Strong Dollar' story to bed with an inflation adjusted purchasing power visual that spans 140 years, courtesy of Advisor Perspectives .

Ok, we've gotten that out the way.
The big news that prompted a USD slide is a Washington Post story released late yesterday afternoon which used anonymous sources who claimed POTUS gave the Russians information they shouldn't have. The mainstream media brouhaha was efficiently put to bed within a couple hours by National Security Adviser H.R. McMaster…
Then from over at ZeroHedge… Euro Surges As Trump Fears Slam Dollar
But going back to the big story overnight, it was all about FX, and specifically the surge in the euro, which extended its recent gains to levels last seen during the US presidential election amid concerns by dollar bulls that political turmoil over the Atlantic will push back the implementation of much-anticipated reforms by the Trump administration.
The USD weakness was not only triggered by HFT 's cherry picking headline news, there's also less than favorable economic hard data to contend with. ** Charles Hugh Smith ** just published a great article ** that explores that rabbit hole…**
If there is one reality that is denied or obscured by the Status Quo, it is that the economy no longer works as it did in the past. This is the fundamental economic context of our current slide into political-social disintegration.
The big picture on all this was succinctly linked together by Jim Rickards this morning…
The damage is not Trump's Russia convo, but deep state leaks to press. Trump is under attack. Investors can forget tax cuts, infrastructure.
Let's talk about those USD Chart Technicals…

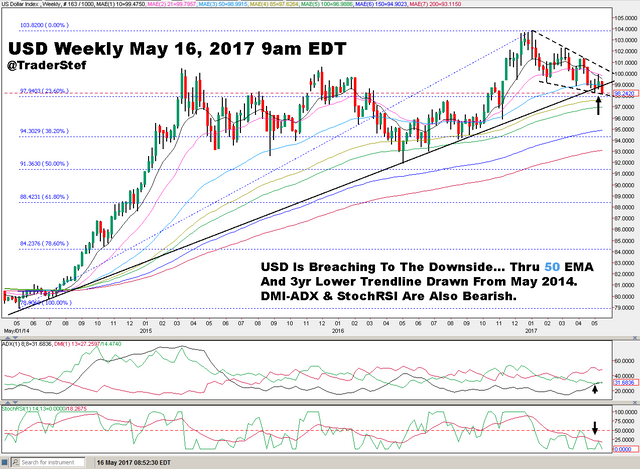
On the Weekly Chart above, take note of that Lower Trendline going back to May of 2014 when the USD began a rally to its recent highs. That's where we have a potential plunge brewing following this mornings breach. Notice 2 weeks ago, the 50 EMA Exponential Moving Average was temporarily breached to the downside, and so far this week we're back under it, as well as falling through that Lower Trendline. The Fibonacci Levels drawn from the $78.90 Low to the recent $103.82 High, price is now nearing the 23.6% at $97.94. If that Fibonacci level is taken out to the downside decisively, expect a visit to the 38.2% at $94.30. And lastly, the DMI- ADX Alligator Tongue is primed for the negative. However, there is a Bullish pattern sticking out at me and could blunt the current weakness. See that Bullish Falling Wedge ?
The next few days and weeks will be telling, and could impact the Gold & Silver price significantly. Plan Your Trade – Trade Your Plan.
TraderStef on Twitter
Great article! Thank you
Downvoting a post can decrease pending rewards and make it less visible. Common reasons:
Submit