Baidu, Inc. (NASDAQ: BIDU) is one of the largest Chinese multinational technology companies specializing in Internet-related services & products and one of the premier AI leaders in the world.
Last week, Baidu has reported excellent results in Q4 which helped its stock to bounce +15%. Solid margin expansion and good developments on several fronts were on the headlines behind the recent rally which switched the opinion of many major investment firms to the bullish side.
We at Elliott Wave Forecast believe the market is ruled by the technical aspect and fundamental news comes in the second place to drive the price to a pre-determined direction. Therefore, we’ll take a look at the 4H chart of BIDU and analyse it using the Elliott Wave Theory.
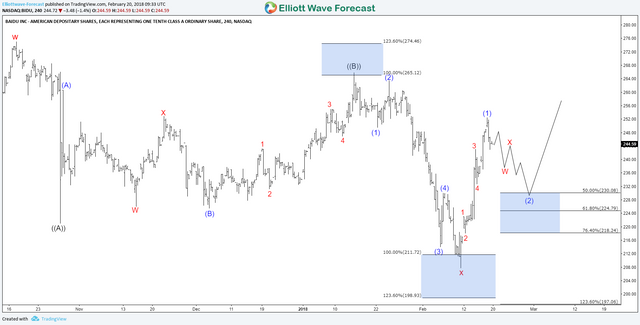
BIDU 4H Chart 02.20.2018

Since October 2017 peak, BIDU did a typical 3 waves correction to the downside which reached equal legs area $211 – $198. Up from there the stock started a new cycle higher and looking to break above $275 peak later on to open a bullish sequence higher.
Currently, the stock ended 5 waves from the lows and expected to see another 3 waves correction which could take it back toward $230 – $218 area before resuming higher again. However, until the stock manage to break above October peak, a double correction lower can still take place.
To have a better perspective about BIDU, we’ll switch to the monthly chart :
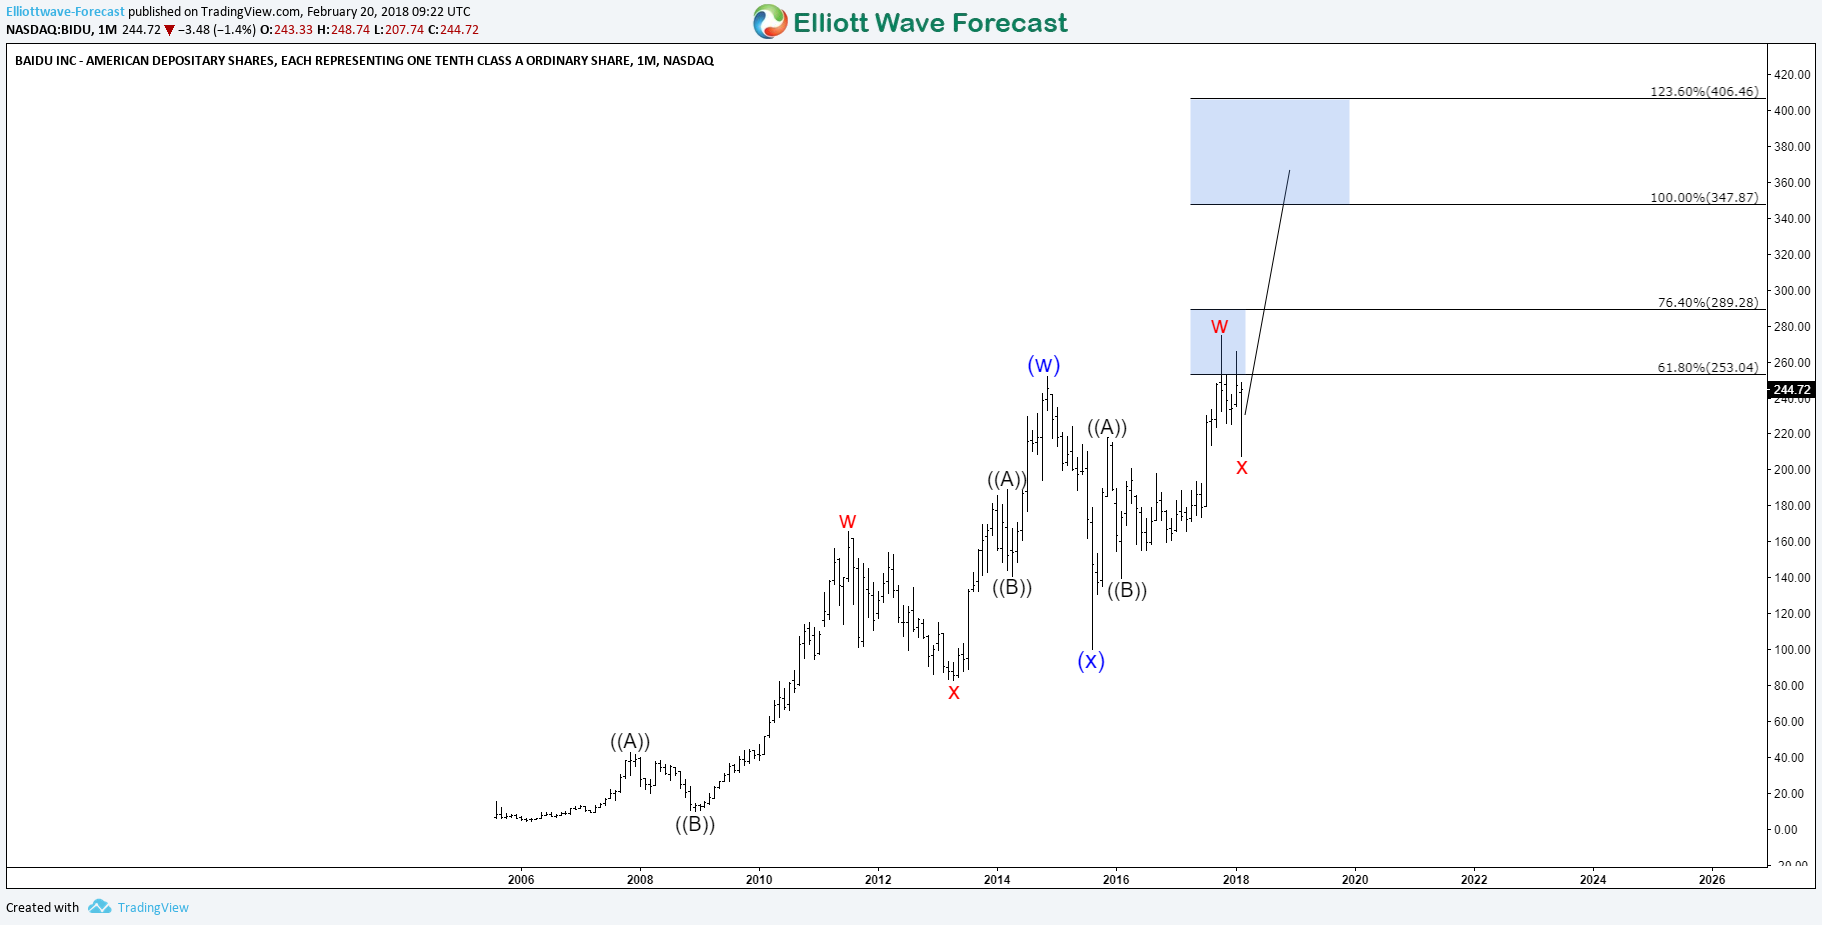
BIDU Monthly Chart 02.20.2018

The Chinese giant Baidu, is showing an incomplete 5 swings bullish sequence from all time low which is different from the regular 5 waves move , as this advance is part of the double three 7 swings structure which suggest more upside toward the target at equal legs area $347 – $406.
BIDU seems to have already ended the 6th swing correction the the red wave x and started the next leg higher. The move will support the rest of related technology stock and we expect the sector to see more upside in the coming years until BIDU achieve its target.
Consequently, after a break above October 2017 peak, BIDU will have a short term bullish sequence and we would favor buying the pullbacks in 3 , 7 or 11 swings whenever available.
If you want to learn more the new Elliott Wave Theory using our system then take this opportunity and try our services 14 days. You’ll learn how to trade Stocks and ETFs using our blue boxes and the 3, 7 or 11 swings sequence. You’ll also get access to our 78 instruments updated in 4 different time frames, Live Trading & Analysis Session done by our Expert Analysts every day, 24-hour chat room support and much more.
Source : https://elliottwave-forecast.com/stock-market/baidu-bidu-resuming-bullish-cycle/
Hi! I am a robot. I just upvoted you! I found similar content that readers might be interested in:
https://elliottwave-forecast.com/stock-market/baidu-bidu-resuming-bullish-cycle/
Downvoting a post can decrease pending rewards and make it less visible. Common reasons:
Submit