Burada yer alan bilgi, yorum ve değerlendirmeler Yatırım Danışmanlığı Kapsamında DEĞİLDİR. Yapmış olduğum analiz ve değerlendirmeler teknik verilere dayalı eğitim çalışmasıdır.
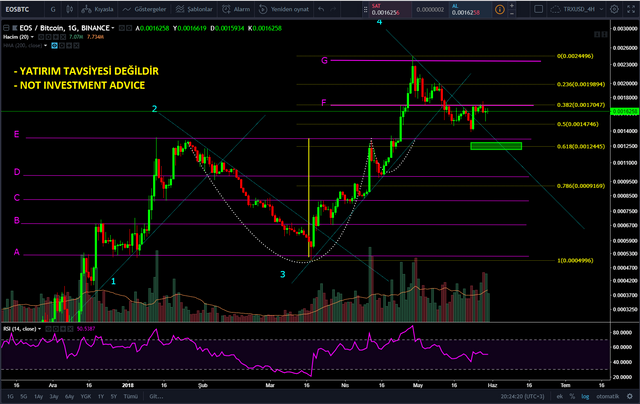
25.04.2018 tarihli günlük grafiktir / The daily chart dated 25.04.2018
Logaritmik ölçekli günlük grafiktir / Daily chart with logarithmic scale
- Grafikte görüldüğü üzere EOS G trendindeki hedefine ulaştı ve o noktadan itibaren düzeltme hareketine başladı.
- Grafik üzerinde FIBO düzeltme seviyelerini belirttim. Bu seviyeler takip edilip trade için strateji belirlenebilir.
- Mevcut durumda F trendnin önemli direnç olduğunu düşünüyorum.
Teknik analiz ile ilgili sorularınızı ve eleştirilerinizi yorum olarak yazmanız beni mutlu edecektir. Analiz etmemi istediğiniz kriptoparaları yorumlarda belirtebilirsiniz.

English
Hello Friends;
- As seen in the chart, EOS reached its goal of G trend, and from that point the correction started to move.
- I have indicated FIBO correction levels on the graph. These levels can be followed and the strategy for trade can be determined.
- I think F trend is a significant resistance in the current situation.
The informations, comments and evaluations contained herein are NOT IN Investment Advisory. The analyzes and evaluations I have made are based on technical data.


Nice one... Do follow me back mate
Downvoting a post can decrease pending rewards and make it less visible. Common reasons:
Submit