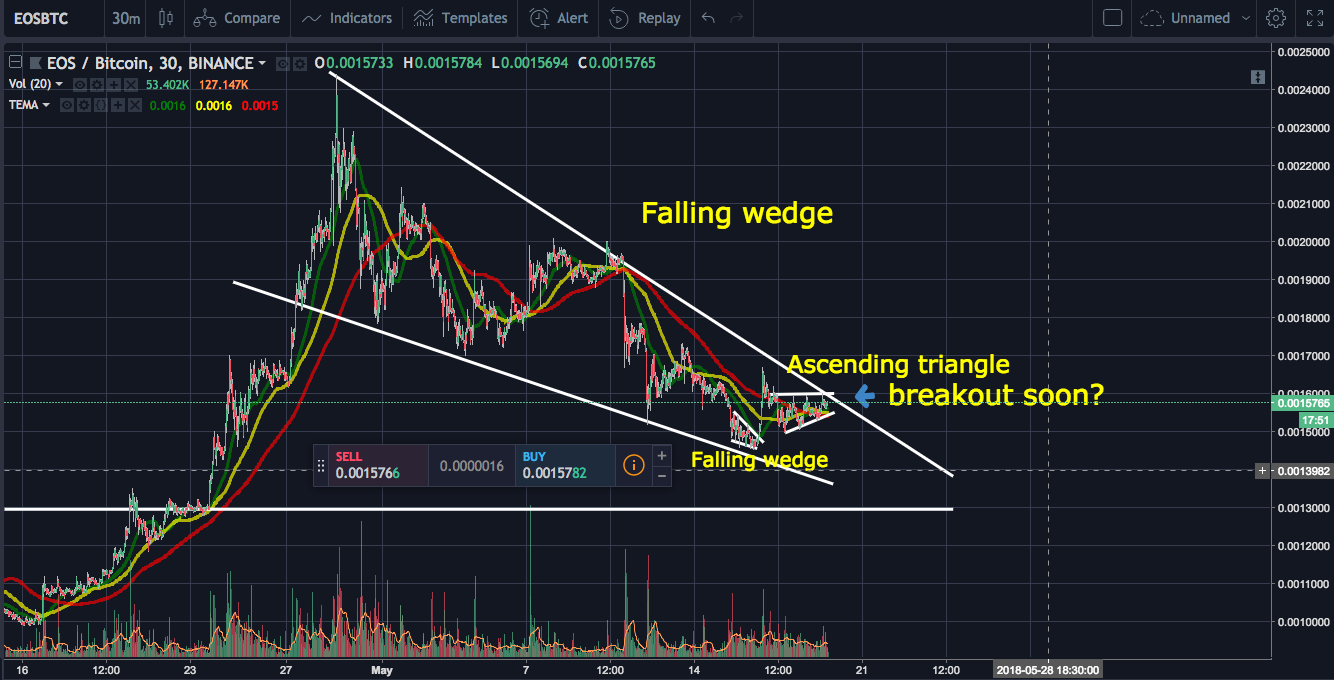
EOS/BTC 30 min chart - what do we see?
In this post, I'll elaborate a bit more on EOS/BTC. In the previous post, I discussed the falling wedge pattern and the possibility of breaking out using the daily chart. In the 30 min chart, you can see another tiny falling wedge and the following breakout but the breakout wasn't enough to go through the resistance line of the big falling wedge.

Mini falling wedge -> Mini ascending triangle
After cooling down a bit, it seems that now it's forming an ascending triangle with slightly increasing volume (see this page for a detailed description of ascending triangle). As the ascending triangle pattern is a bullish signal, the next break out may happen sooner than later but there's still some chance of rejection, of course.
Please upvote and follow me if you like this post.
Where I trade : Binance
Follow me on Twitter : Twitter
Disclaimer : I am not a certified financial advisor. This post is just my personal opinion and not financial advice. Please do your own research and do not trade just based on my posts.