Hello Everyone, our previous post on BTC price prediction was correct, since we posted our TA on BTC price, we have increased in a good number of followers. If you like our TA please invite your friends to join our @cryptospective community here on steemit.
Here is our #ETH technical analysis based on #Binance Charts :
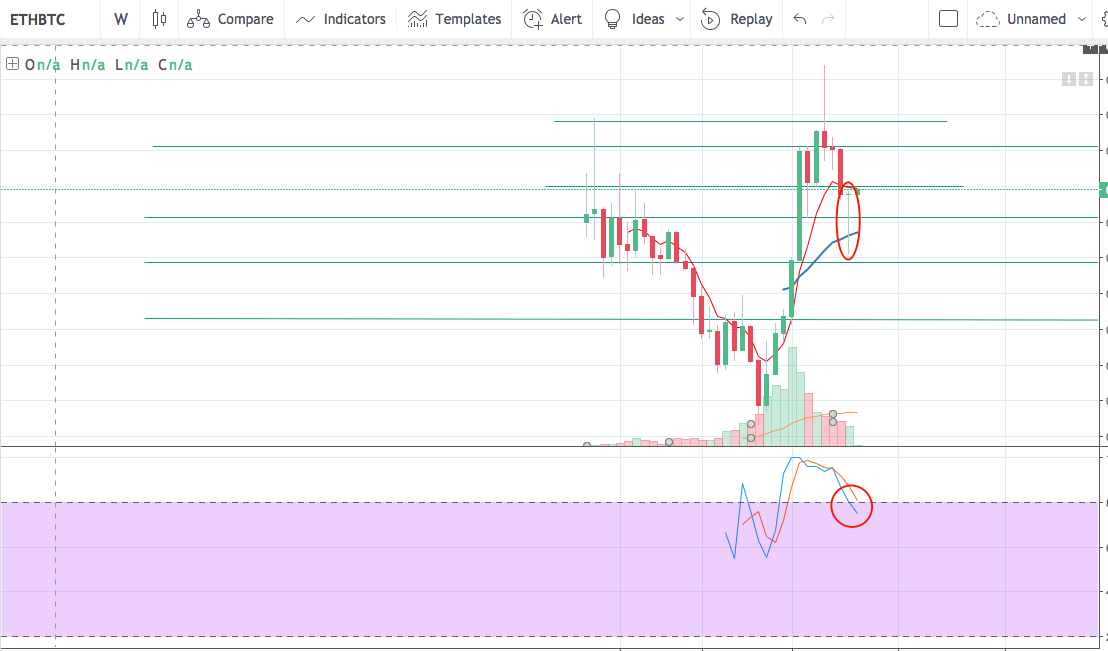
Weekly Overview:
As you can see, last week the chart created a long and nice "Rising star " formation (circled in red) this is a great indicator of the buying force. Despite the fact that Stochastic RSI is slowly crossing from overbought zone to noman zone, however this crossing is still not complete and the slope of stochastic is not steep enough .

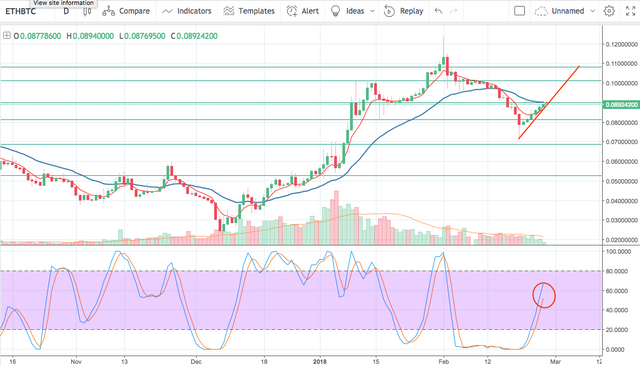
Daily Overview:
On the daily chart, ETH is in a strong uptrend supported by a strong uptrend (red line) along with an strong angle increase in the stochastic indicator- which has a lot of room before reaching overbought level.
Am expecting price to reach 0.1 BTC in the next couple of days as 1st resistance level and if it breaks above that price, we may see it hit 0.11 BTC to say the least.

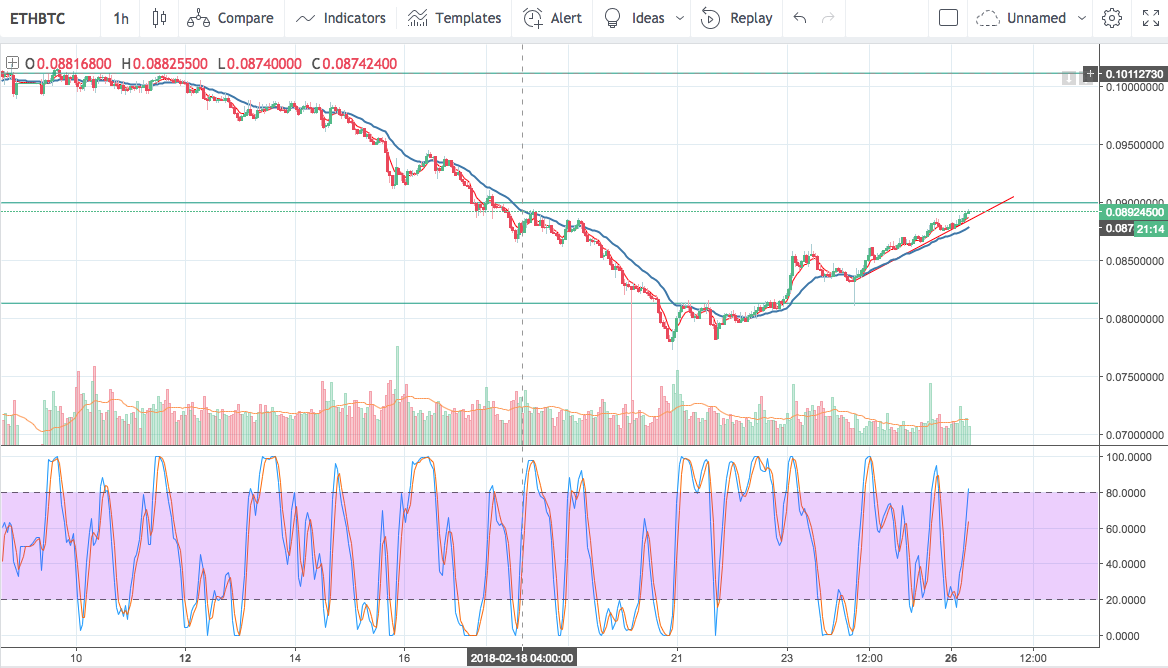
Hourly Overview:
Since we use the hourly chart to find entry positions, we are currently at a perfect entry point. there is a slight resistance level at 0.09 BTC but thats alright, given the previous indicators, price should not find a problem breaking beyond it.

Conclusion: Get in ETH/BTC , its a great buy and take ur profit at 0.1 BTC or 0.11 if you are more risk averse.