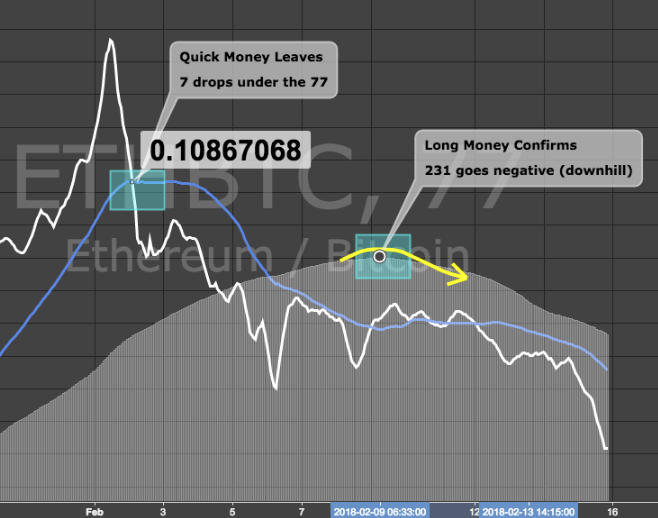
Today I released a video showing that the energy inside the Ethereum chart has been declining for a few days and should take a pretty significant drop over the next week or so. Keep in mind that this analysis in no way detracts from my overall opinion on Ethereum (or its classification as a top-tier coin in the crypto ecosystem) however, it does show that all markets happen in cycles, and that Ethereum may be nearing the end of one of theirs.
This is caused simply by the quick money leaving the market. As we can see on a 77min chart the quick money exited their positions in early February at a price north of 0.10 BTC

After a quick freestyle on a fibonacci to see confirmation on both sides from the 1.2 and the 0.618 - along with a cyclic and sin wave projection we expect to bottom out right before February 20 right north of 0.085 - you may get a sell off candle that goes under that which is basically FREE MONEY!!

PRIME TIME REAL ESTATE - AT FLEA MARKET PRICES.
Put down 2 & Pick up 6!
Stay Cryptic Ya'll.
BK
Full Video Here:
Downvoting a post can decrease pending rewards and make it less visible. Common reasons:
Submit
follow:)
Downvoting a post can decrease pending rewards and make it less visible. Common reasons:
Submit