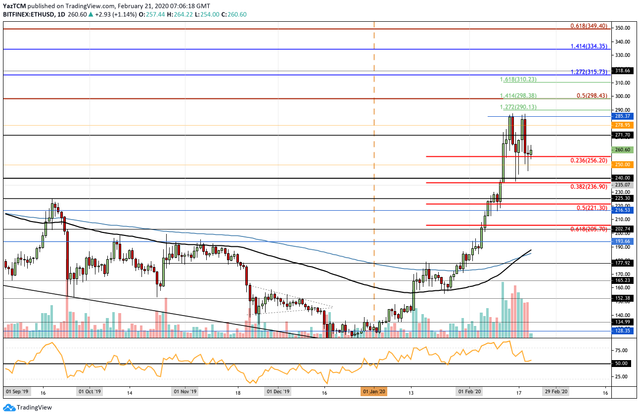
- Ethereum witnessed a small 2.5% price drop over the past week as the cryptocurrency trades at $260.
- Despite the recent price fall, ETH is still up by a total of 55.6% over the past 30-days of trading.
Ethereum has been struggling slightly this week after meeting resistance at the $285 level. It was attempting to break above this level twice during February and has failed on both occasions.
Luckily, the cryptocurrency is finding support at around $256 and looks ready to take another run at the aforementioned resistance level.
Ethereum Price Analysis
ETH/USD – Daily CHART – SHORT TERM

Market Overview
We can see that ETH dropped from the resistance at $285 as it rolled over to fall back into the support at $256.20, provided by a short term .236 Fibonacci Retracement level.
The bulls are attempting to drive higher again as they shape up for the rebound.
Short term prediction: BULLISH
Ethereum remains bullish after rebounding from the $256 support. It would need to drop beneath $220 before we could consider the bull run to be over.
If the buyers climb higher again, the first levels of resistance lie at $271.70, $278, and $265.37 (2020 high). If they can break beyond the 2020 high, we can expect additional resistance at $290 (1.272 FIb Extension), $298 (bearish .5 Fib Retracement & 1.414 Fib Extension), and $300.
Above $300, higher resistance is then expected at $310 (1.618 Fib Extension), $315, $334, and $349 (bearish .618 Fibonacci Retracement level).
On the other hand, if the sellers push beneath the current support at $256, we can expect immediate support at $250. Beneath this, additional support lies at $240, $237 (.382 Fib Retracement), $225, $221.30 (.5 Fib Retracement), and $205 (.618 Fib Retracement).
The RSI has dropped back into the 50 level but it is shaping up for a rebound which shows that the bulls are still in control over the market momentum. One important indicator to note is the fact that the 100-days EMA recently crossed the 200-days EMA giving light to a very strong bullish long term signal.
Key Levels:
Support: $256, $250, $247, $240, $235, $230.
Resistance: $271, $278, $285, $290, $298, $300, $310, $314, $334.
Image from TradingView
Follow CoinGape on social media handles and stay updated!
Telegram | Twitter
Hi! I am a robot. I just upvoted you! I found similar content that readers might be interested in:
https://coingape.com/can-ethereum-break-the-2020-high-on-this-next-attempt/
Downvoting a post can decrease pending rewards and make it less visible. Common reasons:
Submit