Ether Price is forming a Solid Support
This past week was mostly bullish for ETH/USD as the pair formed a solid support around $285.00, and later started an upside move.
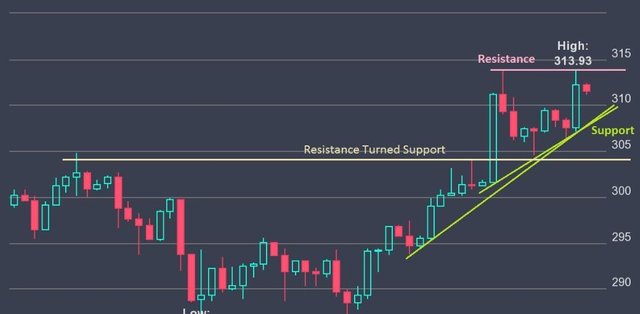
The 2-hour chart of ETH/USD is showing how the pair formed a bottom near $286.00 before starting a new upside wave. During the upside move, the pair broke a couple of key resistances - $300.00 and $305.00.
There is a clear bullish structure forming with support at $305.00. The mentioned level prevented gains earlier and now acts as a support. In addition, there are two bullish trendlines forming with support at $308.00 on the same chart.
On the upside, the pair is currently struggling to break the $313.00-314.00 resistance area. There were two attempts to break the mentioned resistance and a possible third could be looming in the near future.
The price will most likely break the $313.00 resistance area in the third attempt if it stays above $308.00. That support area is important since it is near the 23.6 percent Fibonacci retracement level of the last leg from the $286.72 low to $313.93 high.
Should the price fail to break $313.00, there is a risk of a downside move towards $305.00 in the short term. Any further declines would take the price towards the 50 percent Fibonacci retracement level of the last leg from the $286.72 low to $313.93 high near $300.00, which is a major support
Moving on to the daily chart of ETH/USD, there is a bullish contracting triangle forming with support at $298.00. To the topside, the next major resistance is the 61.8 percent Fibonacci retracement level of the last drop from the $395.41 high to $200.91 low near $321.00.
A successful close above $313.00 could take the price towards $321.00. In the short-to-medium term, ETH/USD remains in the bullish trend and poised to surpass the $313.00 and $321.00 resistance levels.
Weekly Resistance Levels
$313.00 and $321.00
Weekly Support Levels
$305.00 and $300.00
Daily RSI
The RSI has just moved above the 50 level which is a good sign.
Daily MACD
The MACD is slowly gaining momentum in the bullish zone.
Hi! I am a robot. I just upvoted you! I found similar content that readers might be interested in:
https://www.ethnews.com/analysis/10-08-2017-ethusd-weekly-forecast-ether-buyers-are-back
Downvoting a post can decrease pending rewards and make it less visible. Common reasons:
Submit