The current interesting Ethereum news is about Ethereum ETFs which will likely get approval by the SEC in May 2024.
According to Standard Chartered, the ETFs could be approved on May 23. Will this affect the price of Ether? If you compare it with Bitcoin then maybe it could have an influence, when Bitcoin immediately soared to the price level of $49K after the SEC officially approved the Bitcoin ETF application.
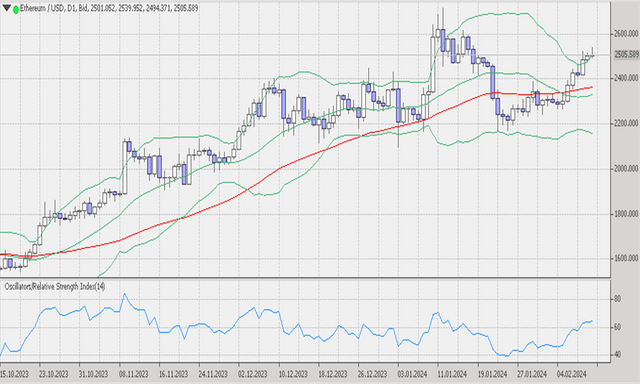
Ethereum price at time of writing at $2505.589 on Ticktrader FXOpen is slightly up 0.39%. Coinmarketcap's Fear and Greed Index shows a value of 67, down 2 points compared to the previous day.
ETHUSD technical analysis

ETHUSD moves above the upper band line. This pair managed to break the upper band line on February 9 and reached a high of $2539.952.
The price is now moving in the range of 2500 and there appears to be a correction by forming a long shadow at the top of the candlestick.
The MA 50 which measures the past 50-day time period forms a flat channel above the middle band line showing a sideways signal.
Bollinger bands appear to be expanding, indicating increasing market volatility.
The RSI, which is an oscillator indicator, shows level 64, which means the price is above the uptrend level.
In the H1 time frame, ETHUSD is moving near the lower band line which may act as dynamic support.
Here the Bollinger bands form a slightly descending channel with a band distance that is not too wide, an indication of normal market volatility.
MA 50, which measures the past 50 hours, forms a flat channel indicating a sideways market.
On the other hand, the RSI indicator which is often used to measure overbought and oversold prices shows level 43, which means the price is below the downtrend level.
#ethereum #ether #ethusd #ethusdanalysis #ticktrader #fxopenuk