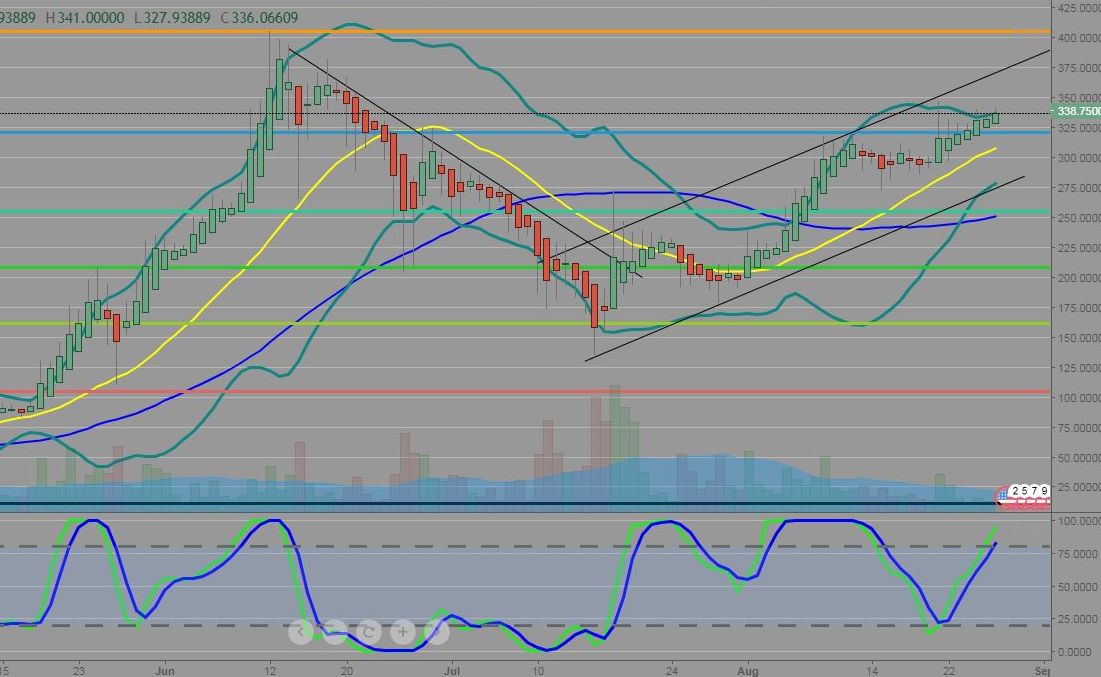
Technical analysis of Ethereum, daily chart from mid May 2017

- Heikin Ashi overlay on candlesticks - Green and trending up, bullish
- Bollinger Bands - Closing in w/current bar just under the upper band, neutral
- Moving averages - 20 day crossed over the 50 day on 8/12/17 w/price above both, bullish
- Trend - Producing higher highs and higher lows after short consolidation, bullish
- Stochastic/RSI - Both K/D lines above the overbought line of 80, 3 days above and it will be 'embedded', neutral
- Trend line - Price is within the trend lines, neutral
- Fibonacci - The price broke above the .786 level (Blue line) after reaching it a few weeks ago and pulling back, bullish
Thoughts: Based on a technical view, ETH looks like it may continue it's slow move towards the previous high near $400. It is taking the 2 steps forward, 1 step back approach compared to the initial parabolic runup to $400. There is no major resistance area up to $400 aside from the upper trend line and maybe at the ~$375 area.
Disclaimer: I hold a position in ETH. See your financial advisor before investing in any asset.

Looking at ETH's long term chart, subtracting the outlying May - July run, the price is on a steady trend line of support.
Downvoting a post can decrease pending rewards and make it less visible. Common reasons:
Submit
Agree, it had to consolidate from going parabolic and did not pull all the way back down to the level in May.
Downvoting a post can decrease pending rewards and make it less visible. Common reasons:
Submit