Ethereum (ETH/USD) Technical Analysis May 16, 2018.
Weekly Chart:

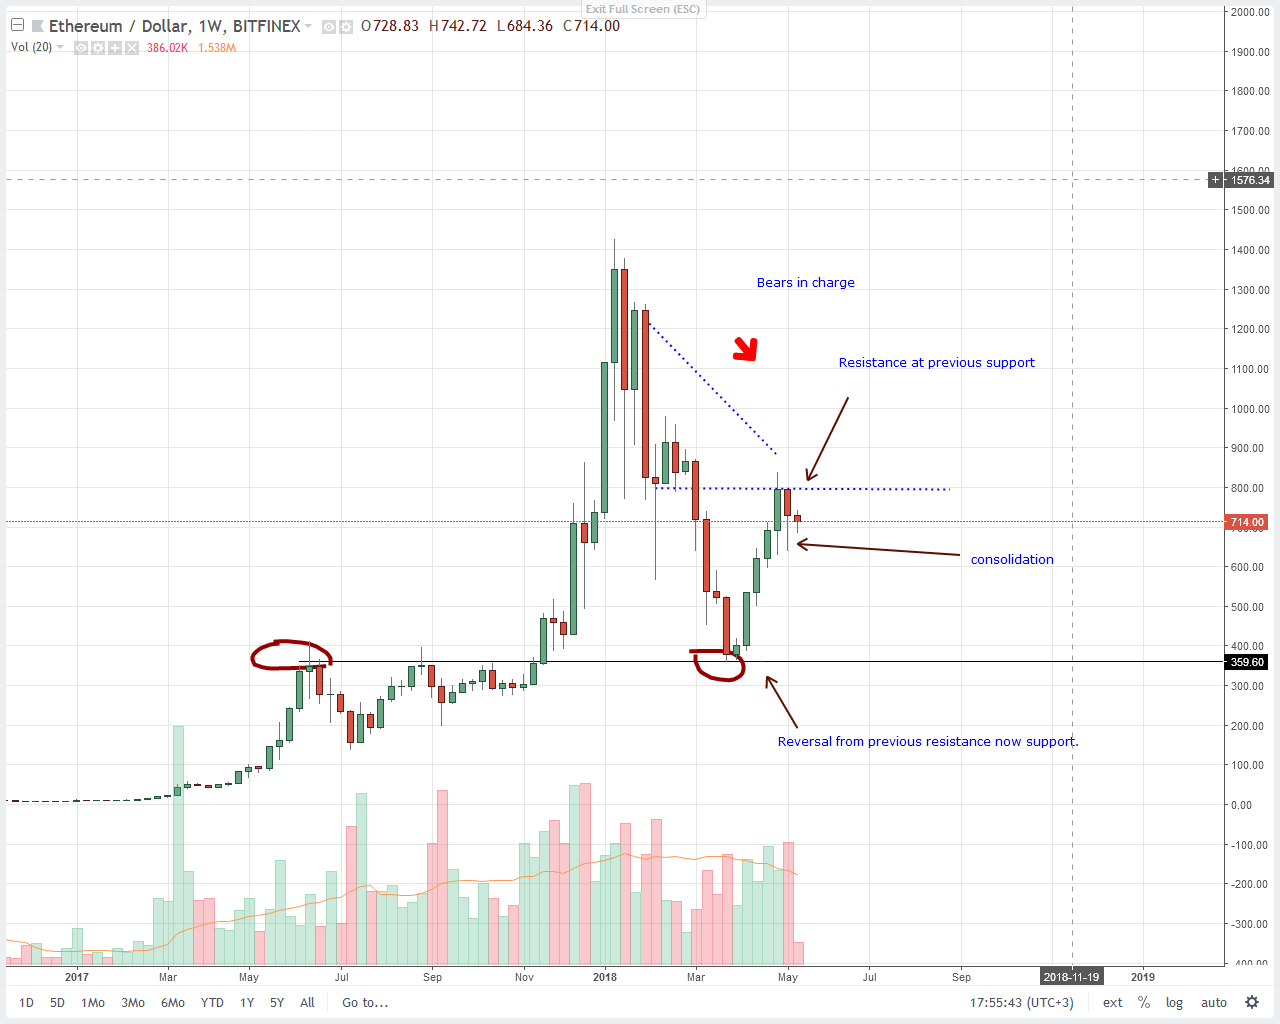
What we can see from this chart is the series of higher highsafter the bullish bounce from support at $350. We must be cognizant of Ethereum buyers who are trying to push prices above the resistance line at $850 though with small volumes.
Prior to this, we only needed buyers to push and close above the main buy trigger at $900. However, sellers are now finding shorting opportunities at every highs as price-volume relationship hints of.
Notice that after week ending May 6, there was an immediate spike in volume but rather than inching higher, there was a drop in prices albeit with a long lower wick. So, if Ethereum buyers are indeed in charge then they must breach $850 with strong volumes. Otherwise, any break below $600 shall attract bear waves reversing April gains.
Daily Chart

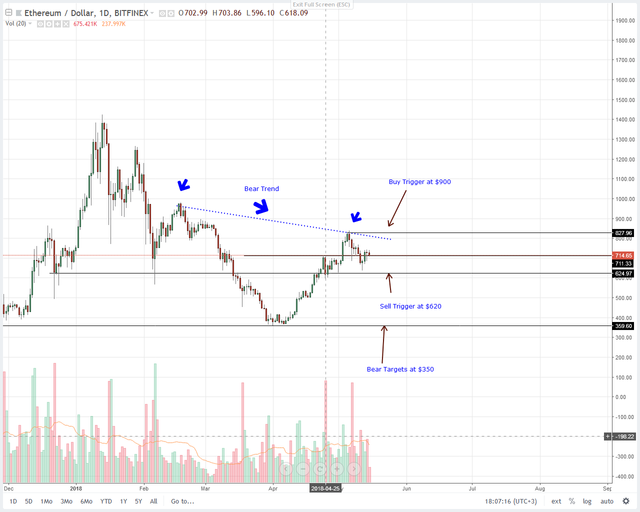
Like the weekly chart, bears seems to be in charge in the daily chart. Here, we can see waves of lower lows after that strong bullish push towards $1350 in the first week of January 2018. At the moment though, buyers are finding resistance with every higher highs.
On May 6 for example, there was a deluge of sell pressure with volumes spiking to 243K up from 193K the previous day. From there sellers have been consistent and despite the last few days attempts of resistance retest, we might see lower lows.Aggressive sellers can sell now and aim for $350 but conservatives can wait for bears breach at $600 before aiming for $350 with stops at $740.
Hi! I am a robot. I just upvoted you! I found similar content that readers might be interested in:
https://www.cryptonewsagency.com/threads/5afbdbc682d9d4001118b367
Downvoting a post can decrease pending rewards and make it less visible. Common reasons:
Submit