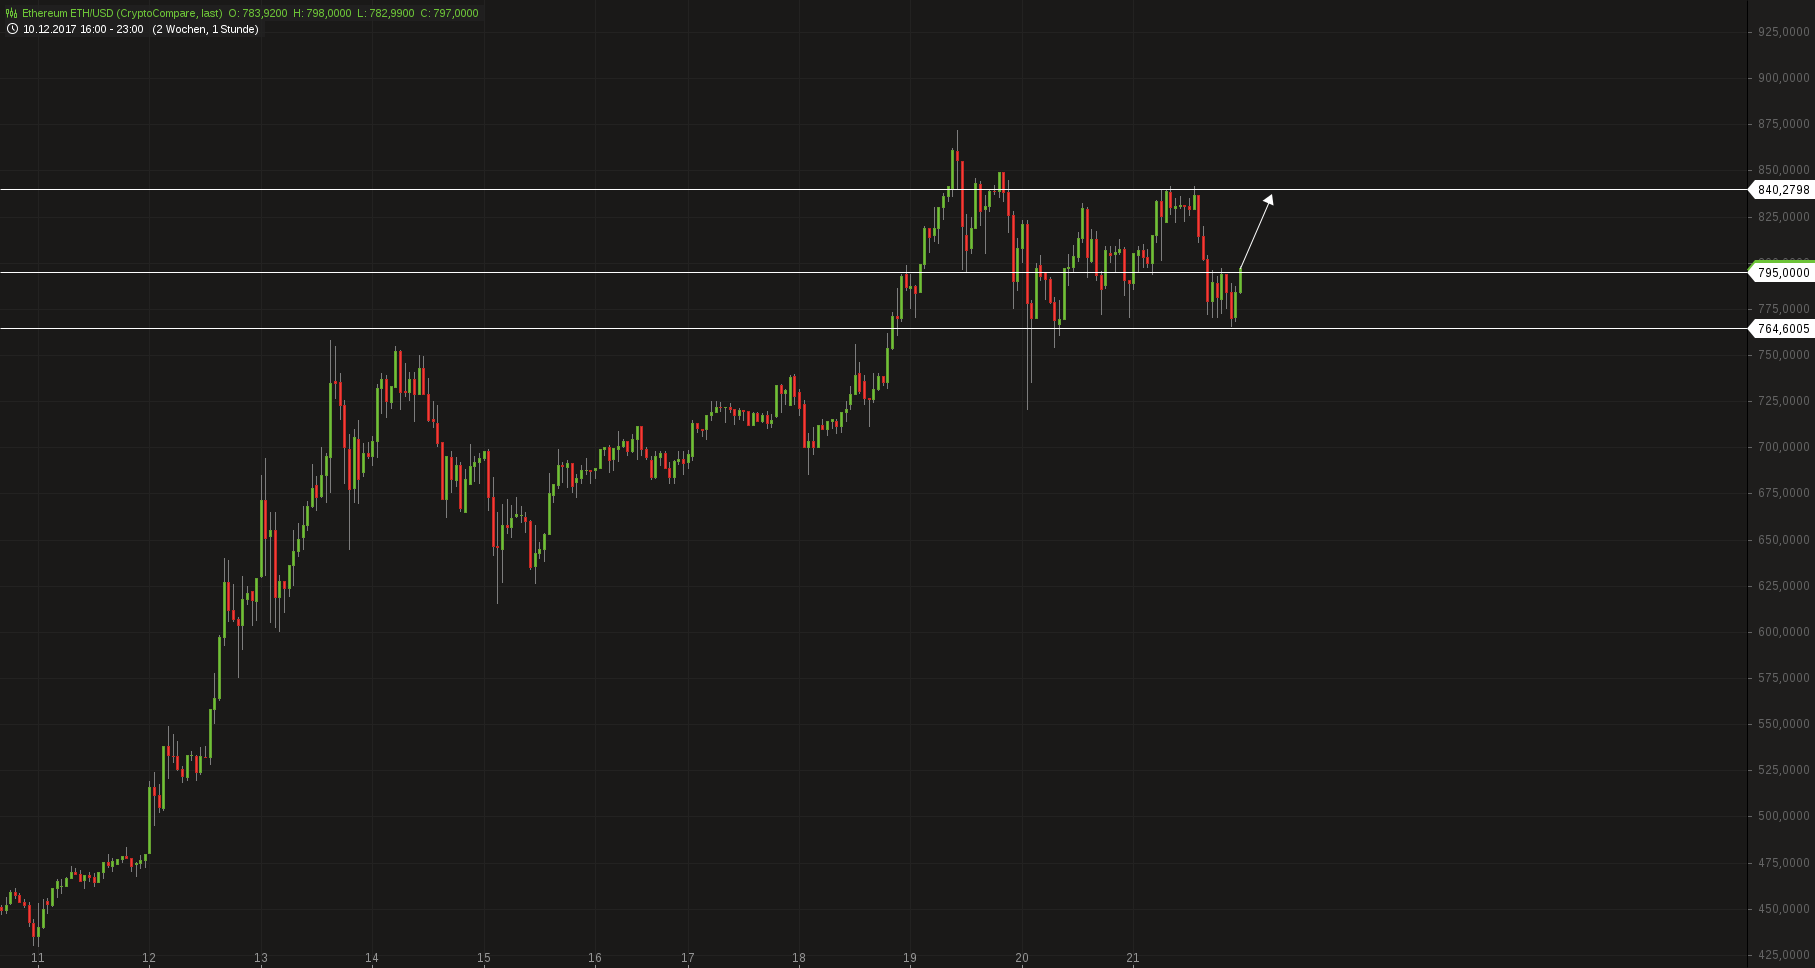
Lets begin again with the hourly chart:

hourly
.png)
daily
Last time I wrote that I would recommend to stay on the sideline because the situation is very unclear. And just to make a guess I slightly preferred the long side. Well, the market went basically sideways.
Today the daily chart is still very unclear and neutral. At least the hourly chart in the shorter time frame looks better. I guess that it is going up again to 840. It will be difficult to break there through. If it does and goes even higher than ~875 it would be a very bullish sign.