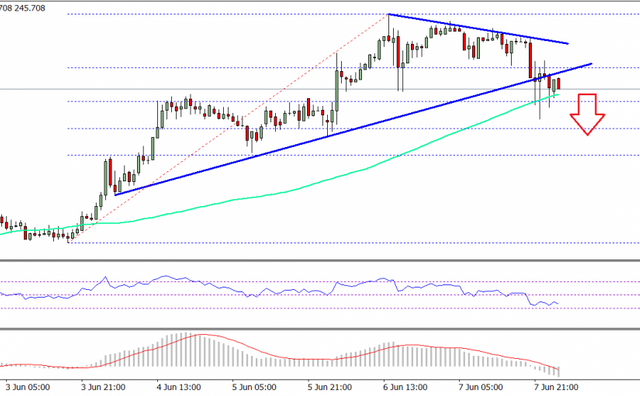
·ETH price after trading as high as $263 found sellers against the US Dollar and moved down.
·There was a major connecting bullish trend line with support at $248.50 on the hourly chart of ETH/USD (data feed via SimpleFX), which was broken recently.
·The pair is attempting a close below the 100 hourly simple moving average and $245.
Read more here: http://www.newsbtc.com/2017/06/08/ethereum-price-technical-analysis-ethusd-downside-break/
Where do you see ETH going in the next 2-3 days? I've been studying candle patterns and back testing what I felt should've been right. Do you have any suggestions of where to learn more in depth information..? Thank you. Also liked and I've been following in silence. Lol.
Downvoting a post can decrease pending rewards and make it less visible. Common reasons:
Submit
How much should you focus on technical analysis?
Downvoting a post can decrease pending rewards and make it less visible. Common reasons:
Submit