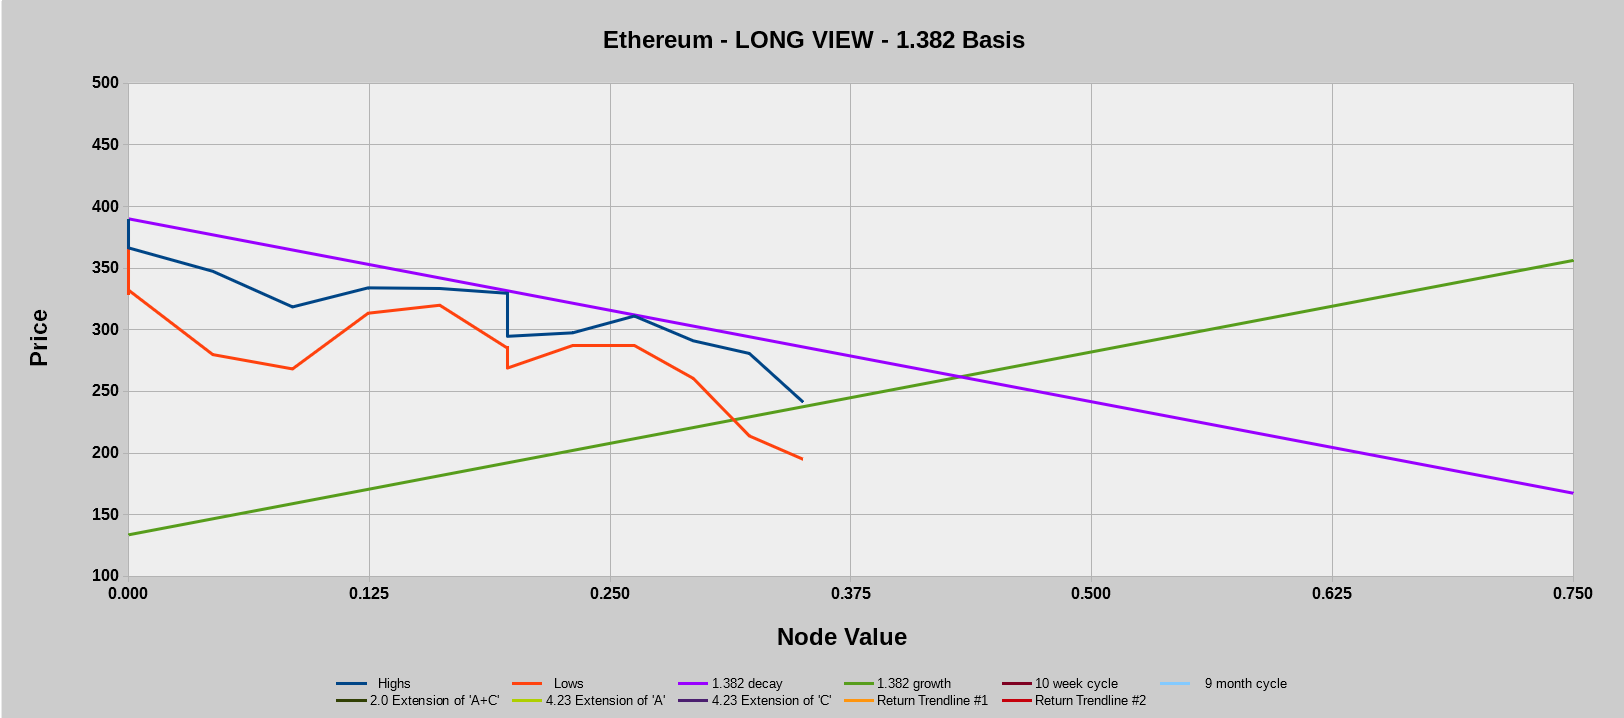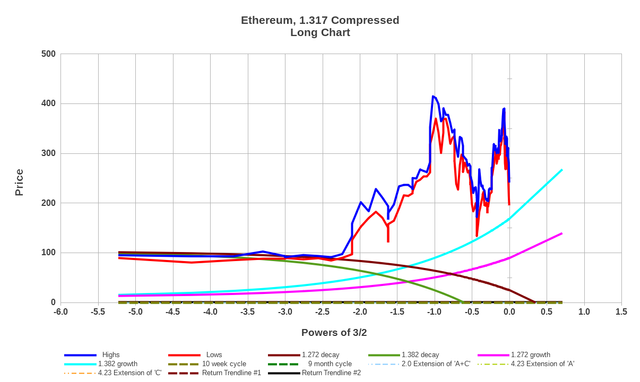
First chart is plotted with Logarithmic time scales and shows the magenta trendline relentlessly forcing price action lower. This won't be considered reversed until the highs of each day climb above that same magenta trendline.
The second chart shows how close this mornings bottom got us to a longer term trendline, down around $169. This is still the potential target if the rally this morning should ultimately fail.

Thanks for your good posts, I followed you! +vote
Downvoting a post can decrease pending rewards and make it less visible. Common reasons:
Submit
Congratulations @mlytle0! You have received a personal award!
Click on the badge to view your Board of Honor.
Do not miss the last post from @steemitboard:
Downvoting a post can decrease pending rewards and make it less visible. Common reasons:
Submit
Congratulations @mlytle0! You received a personal award!
You can view your badges on your Steem Board and compare to others on the Steem Ranking
Vote for @Steemitboard as a witness to get one more award and increased upvotes!
Downvoting a post can decrease pending rewards and make it less visible. Common reasons:
Submit