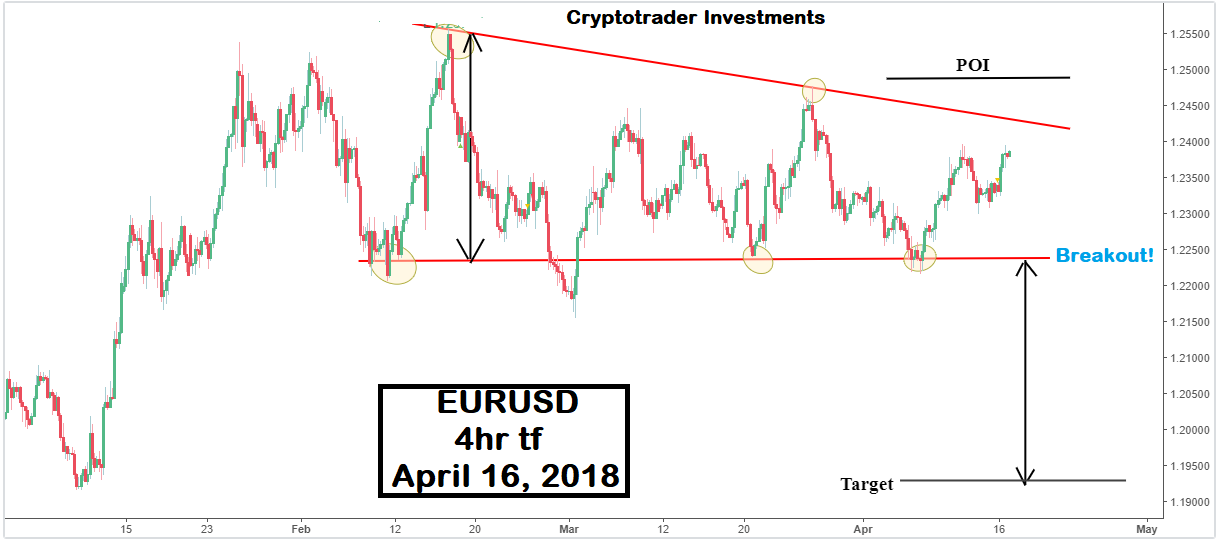
The meandering price action of the EURUSD is captured in this analysis in a descending triangle. This chart pattern is ideally bearish. A close above ~1.24900 is marked as the point of invalidation (POI) for the bearish implications of the 4hr EURUSD descending triangle.

A breakout below ~1.22398 means that the EURUSD could possibly decline to ~ 1.19298 which is marked as the target area.
Target was derived by using a vertical projection of the width of the pattern (i.e. ~ 1.25498 - 1.22398 = 0.031) and subtracting it from the breakout point (~1.22398).
Hey @cryptotrader0029, great post! I enjoyed your content. Keep up the good work! It's always nice to see good content here on Steemit! Cheers :)
Downvoting a post can decrease pending rewards and make it less visible. Common reasons:
Submit
Thank you very much and I appreciate your kind words. Cheers.
Downvoting a post can decrease pending rewards and make it less visible. Common reasons:
Submit