Pivot Tables were once hailed as the most powerful feature of Excel. They allow slicing and dicing of a data table so you can analyse and report within a matter of minutes. They can carry out complex calculations on data that, without Pivot tables you would need to know complex array formula.
In 2010 Excel released the first in its series of Excel Power Tools. PowerPivot. No longer does all of the data need to be in one table to analyse it with Pivot tables. PowerPivot gives the ability to pivot multiples tables of data, without the need to know lookup formula or complex arrays.
In 2010 I hailed PowerPivot as the most powerful feature of Excel. But this was just the first step by Microsoft to bring the power of Data Analysis to the Excel User.
In 2013 Excel released PowerQuery (called Get and Transform Data in Excel 2016) and they also released PowerView. Together these 3 Excel Power Tools, make a compelling Business Intelligence package.
With Excel, you now have the ability to take advantage of the Big Data trend by using both internal and external data to gain actionable insights to your business without the need for a complex IT department.
2017 Excel BI is the most powerful feature of Excel.
In this Article, which is part 1 in 4, we are going to look at how you can add Excel Data to a Data model for use in PowerPivot. You will be introduced to DAX and we will pivot some data from multiple tables.
PowerPivot – Getting Started
If you are using Excel 2010 you must first download and install the PowerPivot add in. A quick search on google and you can find all of the information you need on this. If you are using Excel 2013 or later, Excel PowerPivot is already installed, however you may need to turn it on in the add ins.
How to add data to the data model
Our small set of example data is from an Ice Cream distributor. We have two sheets in an Excel Workbook. One is a sales table and the second table is a customer table.

To add data directly to PowerPivot from Excel, you must first have the data in table format. This is straight forward. Just select any cell within the dataset and press CTRL + t to convert the data to a table. Get into good practice here and make sure you name your table. It will make your life easier later. I have named the tables Sales and Customer.

Once your data is in table format, Select add to Data model from the Power Pivot Tab.

This will open the Power Pivot Screen. But first, go back to the Excel Sheet and add the second table to the data model in the same way.
Now that we have our two tables in PowerPivot, we need to link these tables together. This linking of tables is known as relationships. In the PowerPivot Home tab, under view, select relationship view. As both tables have Customer ID as the similar field, all that you have to do is select Customer ID on one table and drag it across to the other table. A line between both tables will be created, this is the relationship, or the linkage that will allow you pivot and filter across tables.

In PowerPivot we need to set up one to many relationships. In our example, in the Customer table, the Customer ID appears only once. This is the one side. On the sales table the Customer ID appears multiple times. This is the many side.
The sales table is known as a Facts table, whereas the customer table is known as a dimension table or a filter table.
Pivot the data
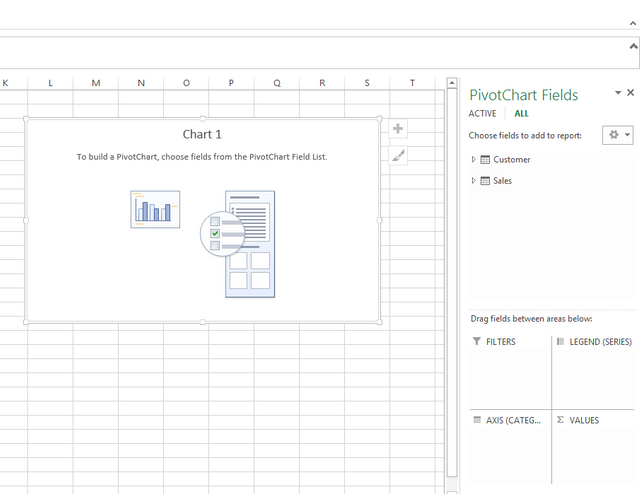
With the data now connected and linked together, we can now prepare some reports. From the Home tab on the PowerPivot ribbon select Pivot tables and then select PivotChart and place the pivot chart on a new worksheet.

On the right you will find the PivotChart Fields. This includes all of the fields from both of the tables. You can then pivot this data as you would with any other pivot table or chart.
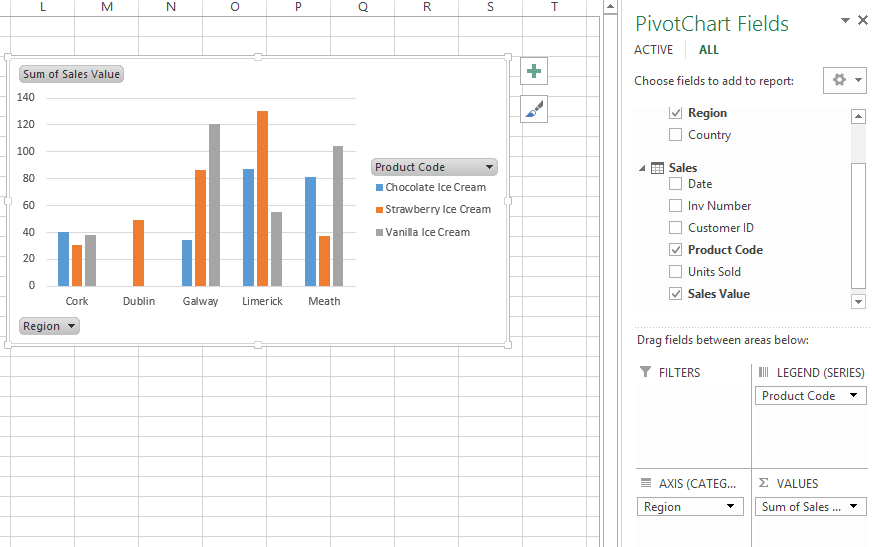
Let’s add our Region from the Customer table to the axis and in the legend let’s add the product code. In the values will we add Sales and ensure that sum of sales is selected.

As you can see we have very quickly produced a visual of Sales value by Region, even thou we didn’t have region in our sales table. It’s very obvious from this visualization that the Ice Cream distributor only sells Strawberry Ice Cream in Dublin but each other region seems to buy all three of the flavors they offer.
This is Power Pivot in its simplest format.
Introduction to DAX
Along with the introduction of PowerPivot, DAX was also introduced. Data Analysis Expressions allow users create custom calculations within and across different tables of data. DAX is made up of many of the same formula that you would find in Excel, such as Sum, Count, IF, And, OR and even Date and time functions. But DAX is also equipped with many more functions such as DistinctCount.
These DAX calculations are created in either a calculated column or a measure. My advices from the start, work with measures. The Excel user would be quick to create more columns in the data set, but the reality is that measures work better in the long run.
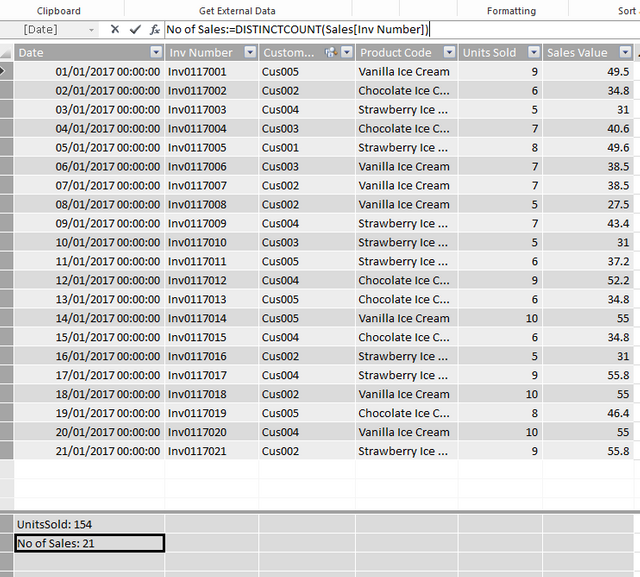
Let’s quickly add some DAX measures to our sales table. Back in our PowerPivot window we can write our DAX formula in the formula bar, just like in Excel. The big difference is that in DAX you are working with tables and columns whereas in Excel you are working with cell references.
Lets begin by writing the following into the formula bar
=SUM(Sales[Units Sold]). This measure will go to the sales table and sum the units sold column.
Lets now carry out another calculation using DAX. Let’s calculate the total number of sales. In the formula bar we will write
=DISTINCTCOUNT(Sales[Inv Number])
This will count the distinct values in the Inv Number column on the sales tables.

If we hop back to our pivot table we will now see that two new fields have been added to the fields list for the calculations that we added. We can now use these fields in our Pivot table as we would use any other fields.
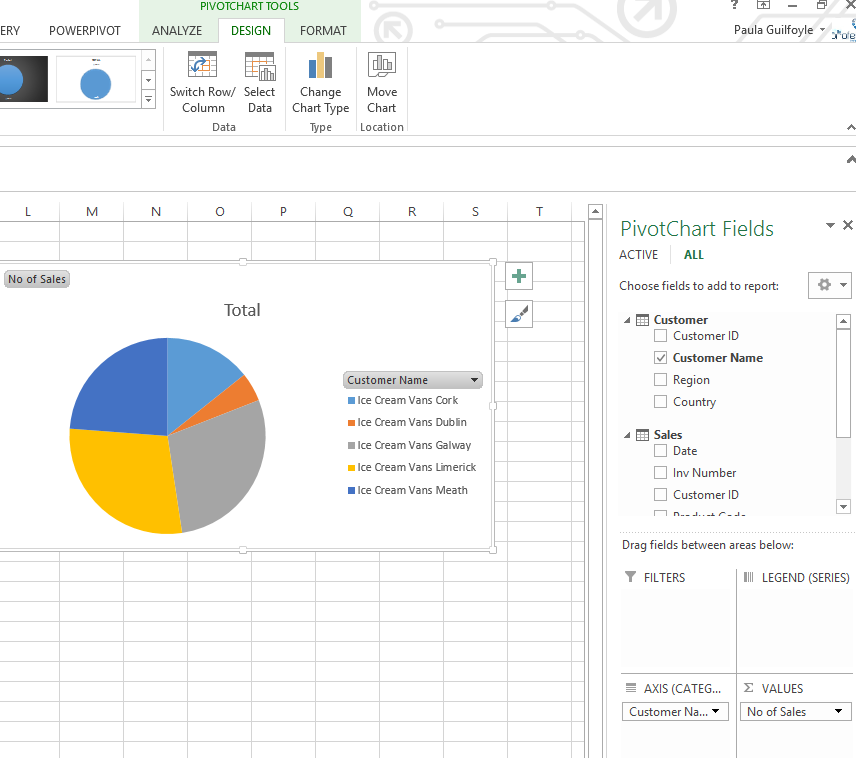
Let’s remove all existing data from the pivot chart. This time we will drop in Customer Name to the Axis and in the value we will add our new calculation, No of Sales. In the PowerCharts design ribbon we will select change chart type and select a Pie chart.

Now imagine you have other tables of data, such as a products table and a supplier table. Imagine the insights you could get then from pivoting all of the data together.
In the next Excel BI article we are going to explore Excels Power Query. Power Query is a tool you can use to get data from different sources, CSV files, TXT files, online information and transform the data into a format that you can actually use with Excels Power Pivot. We will build on this example by adding more tables of data, creating further relationships and look further into DAX.
Spreaaaaaaaaadsheeeet all the things!
Very useful, I use spreadsheets all the time to track trades, portfolio values (tiny) and such.
Thanks for sharing!
Downvoting a post can decrease pending rewards and make it less visible. Common reasons:
Submit
Maybe I could make you a model that auto updates?
Downvoting a post can decrease pending rewards and make it less visible. Common reasons:
Submit
Can it pull data from the bittrex api? :)
Downvoting a post can decrease pending rewards and make it less visible. Common reasons:
Submit
yes. easy peasy. will talk to you on discord.....see what your needs are and see if I can make your life easier.....just cos you are a peach.....
Downvoting a post can decrease pending rewards and make it less visible. Common reasons:
Submit
N'awww... It's puppy love appreciation hour on there atmo. I bounced for a bit to do some steem it stuffs, reminding me too much of what came before.
Downvoting a post can decrease pending rewards and make it less visible. Common reasons:
Submit
I'm pretty keen on this, going to make it much easier to do my daily bookkeeping, next will be to hook it up so it spits out a line every day automatically. :)
Downvoting a post can decrease pending rewards and make it less visible. Common reasons:
Submit