Excel Pivot tables are a really powerful tool. They allow you to create interactive reports on large data sets. You can summaries, organized and explore the information contained within the data, with just a few clicks of the mouse.
To be honest a Pivot Table can be created very quickly. Excel even offers a set of recommended Pivot tables for your data set to get you started. Yet very few people know how to use them, and even less know how to use them to the full potential.
In more recent versions of Excel, pivot tables have become the basis for Data Models and Business Intelligence. In Excel 2010 we saw the launch of the ad in Power Pivot, allowing you to pivot multiple tables of data against each other. Fast forward to 2019 and we now have an extension BI solution in Excel, originally based on the traditional pivot table. We also have the new package, Power BI.
But before we run away with the full capabilities of Pivot tables, it's time we learned some basics. If you are new to Excel Pivot tables then this video is for you. Actually, if you need a refresher on Pivot tables this video is for you too. In this video: Learn Excel Pivot tables in less than 20 minutes you will learn:
- How to insert a pivot table
- How to pivot data on rows and columns
- How to add filters to pivot tables
- How to format a pivot table
- How to use the Value Field settings to summaries data by Sum, Average, Count and more.....
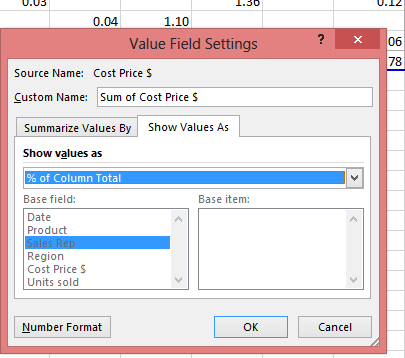
- use Show Value as to perform calculations on your pivot table data such as % of Grand Total
- How to group months and years in Date fields
- Much more
In return for this lesson Learn Excel Pivot Tables in less than 20 Minutes, I ask that you share this post or the video with your friends and colleagues
Sign up for my newsletter – Don’t worry, I won't spam – Just useful Excel and Power BI tips and tricks to your inbox SIGN UP NOW

Find out more now and start earning while you are learning Excel and Power BI
Learn and Earn Activity
Do you want to be rewarded for your learning and attention on this blog? It's easy once you have a steem account to login below. All you have to do is answer the following questions in the comments section below- How often do you use pivot tables and what feature of a pivot table is your favorite and why?
- Describe a situation where you use pivot tables
- Describe a situation where you use the value as settings to perform calculations
- Upvote the comments from others where you found the information they shared to be useful.
Posted from my blog with SteemPress : http://theexcelclub.com/learn-excel-pivot-tables-in-less-than-20-minutes/
I use Pivot tables all of the time. My favorite is the ability to add calculations and I have a need to show value as % of total very often. One example of where i use them is looking at sales and GP by product and rep. In this pivot table I use % of total for sales to see what each rep and product contribute.
Downvoting a post can decrease pending rewards and make it less visible. Common reasons:
Submit
useful information
- Kenroy Hunter
Downvoting a post can decrease pending rewards and make it less visible. Common reasons:
Submit
Everytime I am using Excel I use Pivot tables.
The feature of a pivot table that is my favorite is the one for calculating by addition because it is a good mathematical formula to use.
A situation where I use the value as settings to perform calculations is when I am doing calculations for sales of products.
- Kenroy Hunter
Downvoting a post can decrease pending rewards and make it less visible. Common reasons:
Submit
Learn and Earn Activity 5:
How often do you use pivot tables and what feature of a pivot table is your favorite and why?
I haven't use pivot tables before but from this blog I like the feature where it calculate the profits. This feature is very useful when doing business.
Describe a situation where you use pivot tables.
Pivot tables are suitable for calculating related with sales items.
Describe a situation where you use the value as settings to perform calculations.
You use the value as settings to perform calculations when comes to calculations of anything about sales.
Downvoting a post can decrease pending rewards and make it less visible. Common reasons:
Submit
Pivot tables rock
Downvoting a post can decrease pending rewards and make it less visible. Common reasons:
Submit
They most definitely do
- Kenroy Hunter
Downvoting a post can decrease pending rewards and make it less visible. Common reasons:
Submit
PivotTables are life <3
Downvoting a post can decrease pending rewards and make it less visible. Common reasons:
Submit
Yes, they are.
Downvoting a post can decrease pending rewards and make it less visible. Common reasons:
Submit
I agree
- Kenroy Hunter
Downvoting a post can decrease pending rewards and make it less visible. Common reasons:
Submit
Congratulations @theexcelclub! You have completed the following achievement on the Steem blockchain and have been rewarded with new badge(s) :
You can view your badges on your Steem Board and compare to others on the Steem Ranking
If you no longer want to receive notifications, reply to this comment with the word
STOPTo support your work, I also upvoted your post!
Vote for @Steemitboard as a witness to get one more award and increased upvotes!
Downvoting a post can decrease pending rewards and make it less visible. Common reasons:
Submit