In the previous article, we implemented a simple hedging strategy together, and then we will learn how to upgrade this strategy.
The strategy changes are not big, but the details of the changes need attention. The definitions of some places in the code have changed from the previous ones, which need to be understood.
The need to upgrade this strategy
Switching spot exchange object leverage mode
This change is only related to the real bot. Some spot exchanges have spot leverage interfaces, which are also encapsulated on FMZ. For exchange objects that have been directly packaged on FMZ and support spot leverage, the mode can be switched directly.Add spread chart display
Add spread chart display, because it's just drawing the spread line of A exchange -> B exchange, B exchange -> A exchange , and drawing the horizontal line that triggers the spread. We use the line drawing class library to deal with directly, the advantage is that it is easy to use, here we also learn how to use the template class library function of FMZ.One-sided hedging function
This change can be quite significant, because it is difficult to completely reverse the price difference between the two exchanges during specific hedging transactions. Most of the time the price on one exchange is consistently higher than the price on another exchange. At this time, if our assets have been fully hedged (that is, the coins are all on exchanges with low prices, and the money is on exchanges with high prices). The hedging is stagnant, and it is no longer possible to rely on the fluctuation of the spread to make a profit. At this time, we need to make the strategy so that you can lose a little money to hedge the coins back (let the coins exist on the exchange with high price again), and when the price difference becomes larger again, we can continue to hedge and earn profit.Interactively modify parameters such as hedging spread lines
Add interactive function to the strategy to modify the spread trigger line in real time.Organize status bar information and display it in a table format
Arrange the data that needs to be displayed for easy viewing.
Next, let's implement these designs one by one.
Switch spot exchange object leverage mode
Take Binance spot real bot as an example, switch to spot leveraged mode, use the code exchanges[i].IO, input the parameter trade_normal to switch to leverage position by position, and input trade_super_margin to switch to leverage full position, backtesting is not supported. This is only used in real bot.
Add to the preparation phase at the beginning of the main function:
    // Switch leverage mode
    for (var i = 0 ; i < exchanges.length ; i++) {   // Traverse and detect all added exchange objects
        if (exchanges[i].GetName() == "Binance" && marginType != 0) {   //If the exchange object represented by the current i-index is Binance spot, and the parameter marginType of the strategy interface is not the option of "common currency", execute the switch operation
            if (marginType == 1) {
                Log(exchanges[i].GetName(), "Set to leveraged position-by-position")
                exchanges[i].IO("trade_normal")
            } else if (marginType == 2) {
                Log(exchanges[i].GetName(), "Set to leveraged full position")
                exchanges[i].IO("trade_super_margin")
            }
        }
    }
The strategy here only adds the code for switching the coin-to-coin leverage mode of Binance spot, so the switch setting on the strategy parameters is only valid for Binance spot.
Added spread chart display
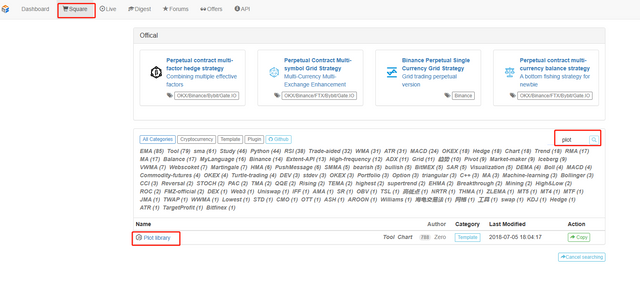
It is very easy to use the already wrapped drawing template. The template name we use is Line Drawing Library. It can be obtained by searching directly on the FMZ platform strategy square.

Or click the link directly: https://www.fmz.com/strategy/27293 to jump to the copy page for this template.

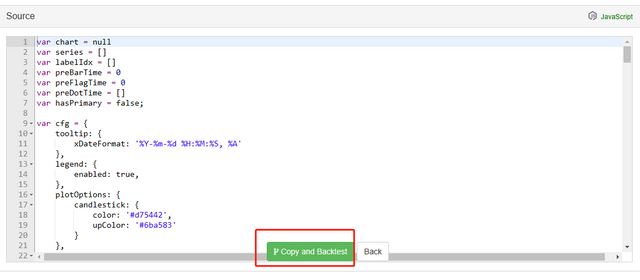
Click the button to copy this template class library to your own strategy library.

Then you can check the template class library to be used in the template column on the strategy editing page. Save the strategy after checking it, and the strategy will refer to this template. This is just a brief description of the use of the template class library. This strategy has already referenced this template, so there is no need to repeat the operation. When you copy this strategy in the strategy square, you can see that Line Drawing Library has been referenced in the template bar on the strategy editing page.
We will mainly learn how to use the functions of the Line Drawing Library to draw a chart.

We plan to draw the spread of A->B, the spread of B->A, and the trigger line of the spread. We need to draw two curves (current A to B, B to A spread), two horizontal lines (trigger spread line), as shown in the figure above.
Because we want to design unilateral hedging, the trigger lines of A->B and B->A are different. We cannot use the design in the previous article.
In the previous article:
      var targetDiffPrice = hedgeDiffPrice
      if (diffAsPercentage) {
          targetDiffPrice = (depthA.Bids[0].Price + depthB.Asks[0].Price + depthB.Bids[0].Price + depthA.Asks[0].Price) / 4 * hedgeDiffPercentage
      }
There is only one trigger spread targetDiffPrice.
So here we have to transform the code, transform the parameters first.

Then modify the code:
        var targetDiffPriceA2B = hedgeDiffPriceA2B
        var targetDiffPriceB2A = hedgeDiffPriceB2A
        if (diffAsPercentage) {
            targetDiffPriceA2B = (depthA.Bids[0].Price + depthB.Asks[0].Price + depthB.Bids[0].Price + depthA.Asks[0].Price) / 4 * hedgeDiffPercentageA2B
            targetDiffPriceB2A = (depthA.Bids[0].Price + depthB.Asks[0].Price + depthB.Bids[0].Price + depthA.Asks[0].Price) / 4 * hedgeDiffPercentageB2A
        }
In this way, the difference trigger line has changed from the previous targetDiffPrice to two targetDiffPriceA2B, targetDiffPriceB2A.
The next step is to draw this data on the chart by using the draw line function of the line drawing library.
        // drawing
        $.PlotHLine(targetDiffPriceA2B, "A->B")  // The first parameter of this function is the value of the horizontal line in the Y-axis direction, and the second parameter is the display text
        $.PlotHLine(targetDiffPriceB2A, "B->A")
When the strategy is running, there is a chart like this.

To be continued...