Direct from the desk of Dane Williams,
This is not your average forex broker blog.
Afternoon team,
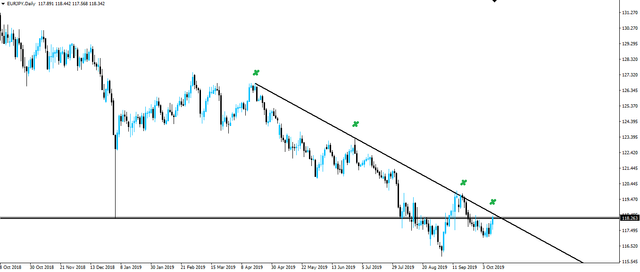
While EUR/JPY has been below support for just over a week now, the pair is now finally retesting the zone as resistance. A confluence between trend line resistance and horizontal resistance from that BOJ spike low.
Just take a look at the updated higher time frame EUR/JPY chart below.
Whenever you have a confluence of support/resistance like this, then you have to take notice. Notice that we're going to have to take.
That trend line is an interesting one that you can look at in two ways. Either the number of touches strengthens the level, or it weakens it. That depends on who you'll ask and what you read.
For me, I don't really care about the number of touches, but just that price is right now below the level. If price is below higher time frame resistance, then I'm looking for shorts and that's exactly the situation we have here. To me that's all that matters.
With EUR/JPY at a confluence of higher time frame resistance, the pair is certainly in-play. Keep an eye on your Inner Circle email for intraday trading setups if price looks like it's going to turn lower.
Best of probabilities to you,
Dane.

@forexbrokr | Steemit Blog
Market Analyst and Forex Broker.
