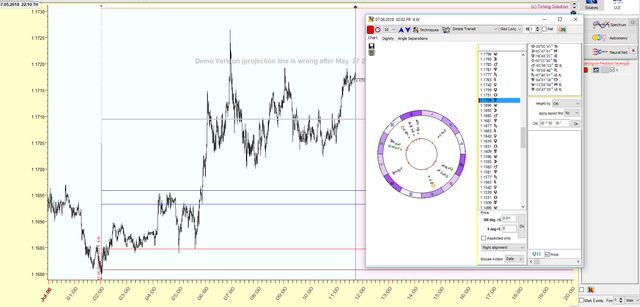
This is a 1 min chart of the EUR/USD on 6 July 2018:
As we can see the lines are strong resistance points even on a 1 minute chart.
Tutorial for plotting these lines: https://steemit.com/forex/@gannamstyle/tutorial-analyse-any-chart-the-wd-gann-way-with-planets-and-get-rich-example-eur-usd
✅ @gannamstyle, I gave you an upvote on your post! Please give me a follow and I will give you a follow in return and possible future votes!
Thank you in advance!
Downvoting a post can decrease pending rewards and make it less visible. Common reasons:
Submit
Do you usually use 1-min charts to analyse intraday movements?
Downvoting a post can decrease pending rewards and make it less visible. Common reasons:
Submit
No sir, I start with the daily plot all the 1 degree lines then the 0.1 degree lines and then the 0.01 degree lines for intraday movement. The lines should be on the same place doesn't matter if you plot 0.01 degree on the 1 min, 15min or daily chart. It just that there are too much lines if you use 0,01 on the daily.
Downvoting a post can decrease pending rewards and make it less visible. Common reasons:
Submit
Congratulations @gannamstyle! You have completed the following achievement on Steemit and have been rewarded with new badge(s) :
Click on the badge to view your Board of Honor.
If you no longer want to receive notifications, reply to this comment with the word
STOPDo not miss the last post from @steemitboard:
SteemitBoard World Cup Contest - Brazil vs Belgium
Participate in the SteemitBoard World Cup Contest!
Collect World Cup badges and win free SBD
Support the Gold Sponsors of the contest: @good-karma and @lukestokes
Downvoting a post can decrease pending rewards and make it less visible. Common reasons:
Submit