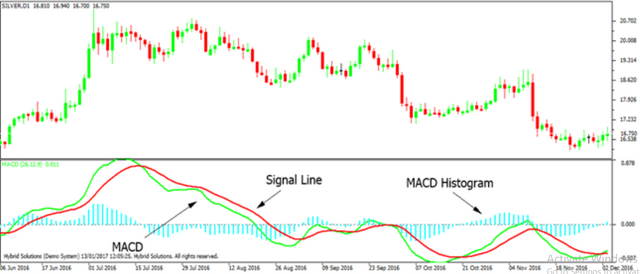
Description
MACD, short for moving average convergence divergence, is a trading indicator used in technical analysis of stock prices, created by Gerald Appel in the late 1970s. It reveals changes in the strength, direction, momentum, and dura on of a trend in a security price. MACD indicator is a momentum oscillator used to trade trends. Although it is an oscillator, it is not typically used to identify over bought or oversold conditions. On the chart it appears as two lines that oscillates without boundaries. The intersection of the two lines provides trading signals.
The concept behind the MACD is very easy; it calculates the difference between a security 26-day and 12-day exponential moving averages (EMA). One of the two moving averages that is constructing the MACD, the 12-day EMA is the faster one, while the 26-day is the slower. In the calculation of their values, both moving averages use the closing. When aching the MACD on chart suing VertexFX, a nine-day EMA of the MACD itself is plotted as well, and it acts as a signal provider for buy and sell decisions. The MACD generates a buy signal when it moves above its own nine-day EMA, and it generates a sell sign when it moves below its nine-day EMA
The Three Major Components
1 The MACD Line
MACD Line is a result of taking a longer term EMA and subtracting it from a shorter term EMA. The most commonly used values are 26 days for the longer term EMA and 12 days for the shorter term EMA, but it is the trader's choice.
2 The Signal Line
The Signal Line is an EMA of the MACD Line described in Component 1. The trader can choose what period length EMA to use for the Signal Line however 9 is the most common.
3 The MACD Histogram
As me advances, the difference between the MACD Line and Signal Line will continually differ. The MACD histogram takes that difference and plots it into an easily readable histogram. The difference between the two lines oscillates around a Zero Line.
When the MACD histogram is above the Zero Line, the MACD is considered positive and when it is below the Zero Line, the MACD is considered negative.
Convergence Divergence

How MACD indicator works
• When the MACD crosses above the zero line, then it is considered bullish signal (signal to buy), while when the MACD crosses below the zero line, then it is considered bearish signal (signal to sell).
• When the MACD elevates from below the zero then it is considered a bullish signal. On the contrary, when it demotes from above the zero then it is considered a bearish signal.
• When the MACD line crosses from below to above the signal line, the indicator is considered bullish.
• When the MACD line crosses from above to below the signal line, the indicator is considered bearish.
• During trading ranges the MACD might whipsaw, with the MACD line crossing across the signal line. Trader who uses the MACD generally avoids trading in this case or closes positions to reduce loss within their accounts.
• Divergence between MACD and price ac on is a stronger signal when it confirms the crossover signals.
DIVERGENCE
• Divergence is another signal created by the MACD. Simply put, divergence is when the MACD and actual price are not in agreement.
• For example, Bullish Divergence occurs when price records a lower low, but the MACD records a higher low. The movement of price can provide evidence of the current trend, however changes in momentum as evidenced by the MACD can sometimes precede a significant reversal.
What makes the MACD such a valuable tool for technical analysis is that it is two indicators in one. It can help to identify trends, and it can measure momentum as well. It takes two separate lagging indicators and adds the aspect of momentum which is much more active or predictive. That kind of versatility is why it has been and is used by traders and analysts.
Despite MACD's obvious attributes, just like with any indicator, the trader or analyst needs to exercise caution. There are just some things that MACD doesn't do well which may tempt a trader regardless. Most notably, traders may be tempted into using MACD as a way to find overbought or oversold conditions. This is not a good idea. Remember, MACD is not bound to a range, so what is considered to be highly positive or negative for one instrument may not be good to a different instrument.
Calculation
An approximated MACD can be calculated by subtracting the value of a 26 period Exponential Moving Average (EMA) from a 12 period EMA. The shorter EMA is constantly converging toward, and diverging away from, the longer EMA. This causes MACD to oscillate around the zero level. A signal line is created with a 9 period EMA of the MACD line.
Note: The sample calculation above is the default. You can adjust the parameters based upon your own criteria.
MACD: (12 day EMA – 26 day EMA)
Signal Line: 9 day EMA of MACD
MACD Histogram: MACD - Signal Line.