This video was originally published 1/7/2019
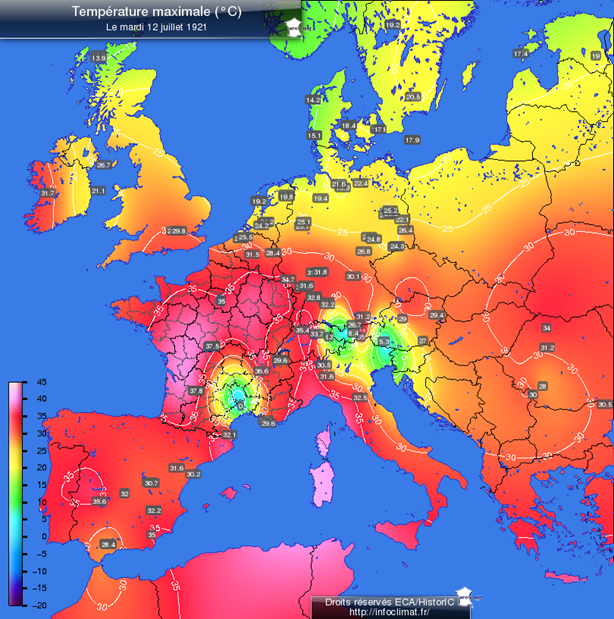
Very good temperature reconstructions were also provided as shown on this map. If you look at it closely, it looks very similar to the heat index that we are seeing today, with Ireland pushing a temperature of 32 degrees Celsius. So, a heatwave is in Ireland, Middle East, and anywhere in that light pink area of the map, which are in the same areas. This record is on July 12th ,1921

When look how hot it got, we are seeing the same thing, almost like someone copy pasted from 1921, and they could read the same headlines or say the same thing, but this time, it is to get you to pay a global tax. Why can we not dig back information from 100 years ago, to see if it is perhaps a hundred-year cycle?

Meteo Paris has this very interesting article, “The weather chronicles of the year 1921.” You can break down the data by year and check out the weather in 1922, 1923, 1924, or even back to 1880, all the way through now. The one I highlighted in blue stating, “July 13th had a scorching heat and a maximum of 44.8 degrees Celsius in Bourg — this is the highest non-official value measured in the shade, in France,” is just a few snippets I grabbed in this site.

How is this information missed in the French media? I understand I had to use Google and Google Translate to get the French translator, but still, if I was able to find it, the French media should have too.
This, also, is another interesting story on the Seine River, where people were cooling off in a 1921 photo. Accordingly, this, of the entire year of 1921, was the hottest and the driest Paris since the beginning of weather records in 1851. At present, we have the same extreme heat and scorching winds again. Do you think it is a cycle?

If you however check some big media outlets like Business Insider, which talk about these heatwaves, they still refer temperatures in 2003 with 44.1 degrees Celsius, and in Avignon, this year, with 44.3 degrees Celsius as the warmest recorded. They missed 1921 as well, so I am not sure any more of these big media outlets are doing research.

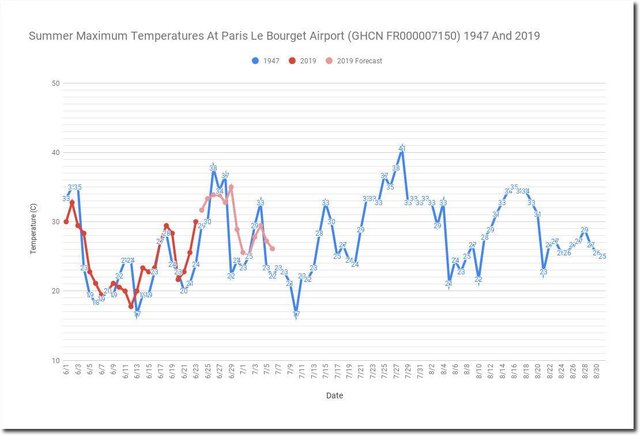
Paul Maxit put down the hammer as well, calling for, “The bad CO2 causing the 2019 the same time record heat as in Paris in 1947.” How could that happen?

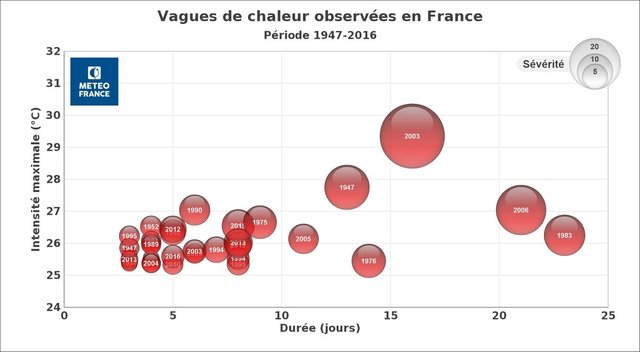
(BELOW) Other heatwaves, in addition to 1947, as shown in this chart, were also overlooked. The largest heat bubble is 2003, which lasted about 18 days, 1947 is just a little bit lower in count, but then, look all the way over in 1983 and 1976.
Why were none of these mentioned in any of the news reports? Rather, the reports are all clustered around the 5-, 4-, or 3-day events, which are way lesser intense heatwaves?

Now, look closely at the graph put out by Paul Maxit. The red graph shows the maximum Paris temperature in 2019, and blue is in 1947. The media has been squawking about the hottest month ever, the hottest time ever, the hottest planet ever, and especially, focusing on in France. Shown in this graph are the numbers so far, for the entire month of June into the first day of July. As can be seen, even the forecast in the lighter pink graph, is below the 1947 historical heat for the same time. This, indeed, is a cycle.

I, however, appreciate some media outlets like the European WMO, for coming out with little sense, instead of hysteria. At least they warn as this heatwave unfolds, graphics with light pinks will have local temperatures above 40 degrees Celsius, avoid fire hazards and take care of your health.
That is a great way to give warnings without eliciting hysteria. That is the way news should be.

Again, for this headline, Heatwave: 45.92 degrees Celsius, absolute heat record beaten in France, note where the data was taken from.

That data was taken in this temperature station on a roof, and we know that hot things react differently when they absorb direct sunlight. Also, UV changes in the Sun can make things even hotter. Thus, this heat record really needs to be reinvestigated; and that temperature station needs to be under a box. That is bad science data gathering. It is the same as putting these types of instruments at the end of a runway, or a landing area of an airport, or in the middle of a parking lot.

The problem is, articles like these, are guaranteed to be throttled back. Look at what YouTube is already doing in one of my videos. In this particular video, I talked about areas that will become more habitable during the Grand Solar Minimum, and this is what happened: 20 comments, 86 likes, 4 dislikes, but zero views.

This censorship going on in different media outlets, including Amazon, made us decide to self-publish this book entitled, Climate Revolution: The Grand Solar Minimum, Understand — Prepare — Adapt — Thrive. This book takes into consideration historical changes in the last 5 Grand Solar Minima, going back 2,000 years and even further back to 3,600 years before our present date to look at the climate. Included in this book are discussions on what the changes are, what events you can expect, how the society and the economy moves, and analyses on how food prices rose or will rise, as this whole social fabric of our society starts to wither and rip apart because of all these changes that we are seeing.
Our decision to self-publish is because the censors in Amazon would do the same thing that the censors in YouTube, Facebook, Twitter do everywhere you put this type of information questioning the CO2 narrative.
Global taxes are one thing, but I personally believe, that powers that be are trying to stop global panic when people wake up to the reality, that this Grand Solar Minimum is going to be a 20-year event with seemingly unending food price rises. But then, covering up the reality would mean nobody is prepared when this thing finally strikes.

Thanks for reading, I hope you got something out of the article. If you would like more content like this, I produce the tri-weekly Mini Ice Age Conversations podcast, 30 minutes of in-depth analysis on the GSM you can take on the go through out your day.
Mini Ice Age Conversations Podcast
iTunes: https://itunes.apple.com/us/podcast/adapt2030
Soundcloud https://soundcloud.com/adapt-2030
Libsyn http://adapt2030.libsyn.com/
(MIAC #226) Will Industry Proactively Jump To Action Before 2028 Global Starvation

For the bi-weekly Grand Solar Minimum climate update newsletter from myself, David DuByne, (ADAPT 2030) jump over to oilseedcrops.org you can enter your email and sign up. Move your mouse around for about 10 seconds and this box will pop up.
Join ADAPT 2030 NEWSLETTER http://www.oilseedcrops.org

“Help support the adapt 2030 channel on brighteon so we can keep Grand Solar Minimum information free to access.”
https://www.brighteon.com/channel/adapt2030
Support ADAPT 2030 by Visiting Our Sponsors
ADAPT 2030 & My Patriot Supply 2-Week Food Supply with 92 servings
www.preparewithadapt2030.com
True Leaf Market Heirloom Seeds ADAPT 2030 True Leaf Market Link
ADAPT 2030 Amazon Grand Solar Minimum Book Store https://www.amazon.com/shop/adapt2030
Upheaval: Why Catastrophic Earthquakes Will Soon Strike the United States https://amzn.to/2E7KbBt
*** Today’s Story Links ***
French climate and temperatures roof top temperature station
https://www.infoclimat.fr/observations-meteo/temps-reel/gallargues-le-montueux/000OZ.html
Heatwave: 45.9 ° C in Gallargues-le-Montrieux, absolute record of heat beaten in France
http://www.lefigaro.fr/sciences/canicule-quatre-departements-en-alerte-rouge-une-premiere-historique-20190627
http://www.leparisien.fr/video/45-9-c-record-absolu-de-chaleur-enregistree-en-france-28-06-2019-8105763.php
1921 UK and French temperatures
https://www.infoclimat.fr/cartes/observations-meteo/archives/temperature-maximale-journaliere/12/juillet/1921/00h/france.html
https://www.infoclimat.fr/cartes/observations-meteo/archives/temperature-maximale-journaliere/13/juillet/1921/00h/france.html
Weather chronicles in France 1921
http://www.meteo-paris.com/chronique/annee/1921
113 degrees in France: why Europe is so vulnerable to extreme heat
https://www.vox.com/world/2019/6/26/18744518/heat-wave-2019-europe-france-germany-spain
https://www.businessinsider.com/europe-heatwave-france-germany-spain-dangerous-temperature-2019-6
French heatwaves over last 70 years 
https://www.businessinsider.com/europe-heat-wave-cause-high-pressure-weather-system-2019-6
France hottest ever record
https://www.europe1.fr/societe/459c-devient-le-nouveau-record-de-chaleur-jamais-enregistre-en-france-3907113
https://www.bfmtv.com/planete/canicule-443c-mesure-a-carpentras-le-record-de-chaleur-en-france-battu-1721785.html
French temperatures over time since 1947
https://twitter.com/PaulMaxit/status/1144584923581468672

*** ADAPT 2030 Social Media Links ***
PATREON https://www.patreon.com/adapt2030
YOUTUBE ADAPT 2030 Mini Ice Age 2015–2035 Series on YouTube
BITCHUTE https://www.bitchute.com/hashtag/adapt2030/
BRIGHTEON https://www.brighteon.com/channel/adapt2030
STEEM https://steemit.com/@adapt2030
MINDS https://minds.com/ADAPT2030
MEDIUM https://medium.com/@globalcooling
FB https://www.facebook.com/Miniiceage
TWITTER https://twitter.com/adapt2030
STEEMIT https://steemit.com/@adapt2030