Trading charts are like roadmaps for traders exploring the exciting stock market. They help us understand price movements, spot trends, and aid in making smart decisions. But guess what? There are numerous types of trading charts. Each has its own unique features that can make your trading experience even more thrilling. So, get ready to dive into the world of trading charts.
Common Types of Trading Charts
There are various charts in trading. They serve specific purposes and functions. The most common types of chart patterns in stock market trading include:
Candlesticks
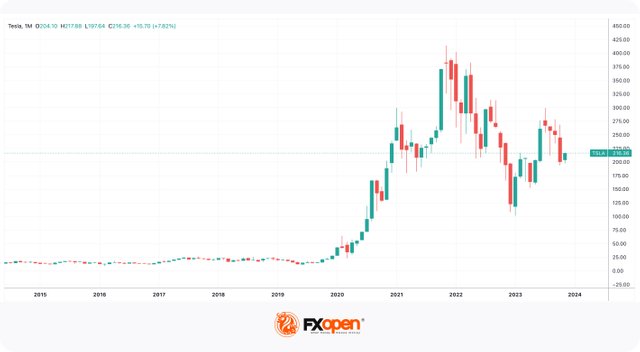
Candlesticks are financial charts used to represent price movement in stocks, currencies, or other assets over a specific period. They provide visual information about price direction, open, close, high, and low prices, trend strength, and market sentiment, helping traders analyse and make informed trading decisions. You can easily recognise stock market patterns on this chart type.

Heikin Ashi
The Heikin Ashi is a financial chart used to analyse price trends and trend reversals in stocks, forex, and other assets. It employs a modified formula for calculating the open, high, low, and close prices of each period, making it easier for traders to identify the overall trend direction and potential reversal points.