In trading, the Fibonacci sequence, notable for its mathematical and artistic significance, is adapted into tools like the Fibonacci retracement and spiral. These tools provide traders with a unique perspective on market trends and potential reversal points, using ratios derived from the sequence to analyse price charts. This article focuses on the Fibonacci spiral, exploring its application and interpretation in financial trading.
The Fibonacci Sequence and Trading
Traders often ask, “What is a Fib in stocks?”. A Fib refers to a tool using the Fibonacci sequence, typically a Fibonacci retracement. This series of numbers, where each is the sum of the two preceding ones, has long intrigued mathematicians and artists alike.
In trading, the Fibonacci retracement uses ratios (23.6%, 38.2%, 61.8%, and 78.6%) to identify potential reversal points on price charts. These levels are drawn by taking two extreme points, usually a high and a low, and dividing the vertical distance by the key Fibonacci ratios.
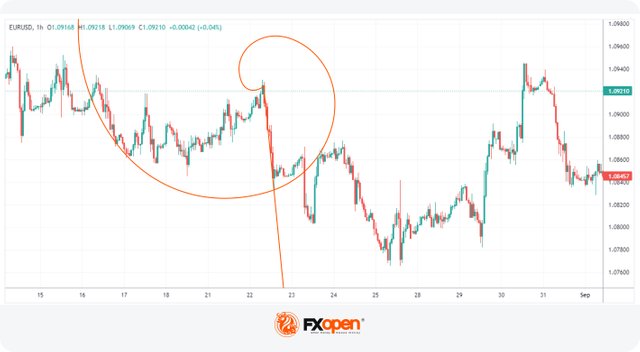
The concept extends to the Fibonacci spiral, a more complex tool that incorporates the same mathematical principles. The Fib spiral applies these ratios in a circular format, offering a unique perspective on potential price movements. By wrapping the Fibonacci sequence into a spiral, traders can visualise both time and price movements in a dynamic way.
What Is the Fibonacci Spiral?

Read full story visit FXOpen blog