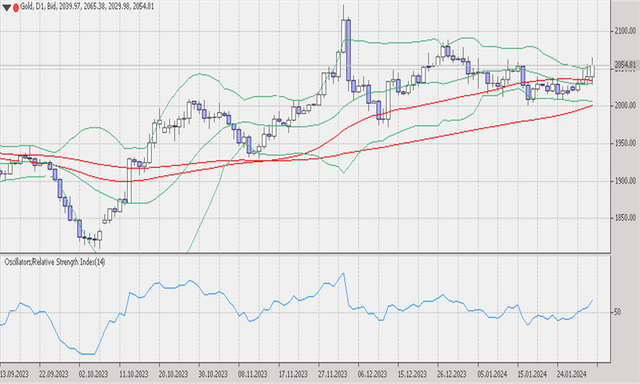
Gold prices soared to a high of 2065.38 based on Ticktrader FXOpen. Gold prices appear to rise because the dollar's strengthening was restrained after the FOMC.
As reported, the Fed lowered expectations of cutting interest rates until at least March, Federal Reserve Chair Jerome Powell said that the central bank needs greater confidence that inflation will reach the target
Before the meeting, the market estimated that the chance of an interest rate cut in March was 50: 50, but the probability now looks to be only 35%. However, financial markets still expect the US central bank to cut interest rates by almost 150 basis points this year.
The strengthening of gold may also have been triggered by the news of the surprising loss of Community Bancorp bank in New York which threatened the stability of the US banking system. The bank's shares fell 45% after suffering sudden losses due to worsening credit quality and lower dividends.
Technical analysis of gold on the daily timeframe, the price has formed a bullish candle and succeeded in crossing the upper band line, it formed a bull candle with a long body and short shadows on the top and bottom candle.
There you can see MA 50 forming a flat channel near the middle band line, indicating a sideways market. Meanwhile, the 200 MA below the lower band forms an upward channel indicating a long-term uptrend.
In the H1 timeframe, the gold price is now starting to see a weakening rally, the price was corrected to 2054 after rising to a high of 2065. The Bollinger band appears to be expanding, indicating high market volatility. The 50 MA near the middle band forms an upward channel indicating an uptrend, and the 200 MA near the lower band also forms an upward channel. Meanwhile, the RSI indicator shows level 62, meaning the price is above the uptrend.
#gold #xauusd #goldprice #goldanalysistoday #ticktrader #fxopenint