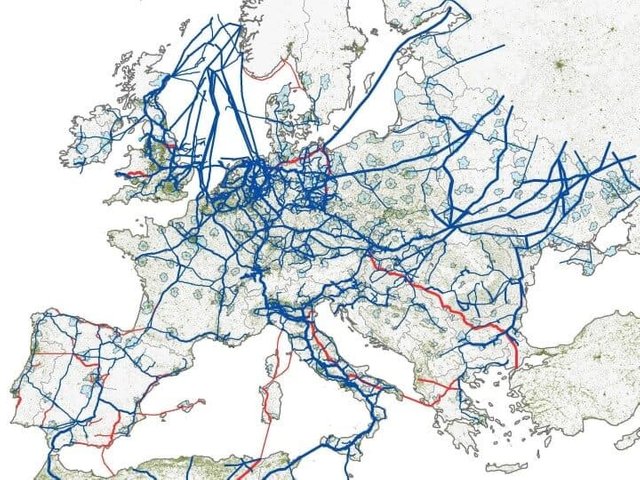
The map above shows existing European natural gas pipelines in blue and planned pipelines in red. Large urban areas area coloured light blue and population density is shown in green.
The map is a little out-of-date since it was created back in 2014, but you can see a 2017 map here.
Nevertheless, its interesting to see the density of pipelines in places such as Germany, the Netherlands and the UK compared to places such as the South of France or the Balkans.
And of course one cannot fail to miss the number of pipelines originating in Russia.
You can learn more about UK gas prices here.
