Current gold price in 2025 on Ticktrader FXOpen. Predictions Aakash Doshi, Citi's North America head of commodity research predicts gold could reach $3000. Even though it seems like an exaggeration, who knows, maybe it's true
The price of gold appears to have started to move up from 1984 on February 14 and has now reached a high of 2032 on February 21, although it will fall again in 2025.
Technical analysis of gold

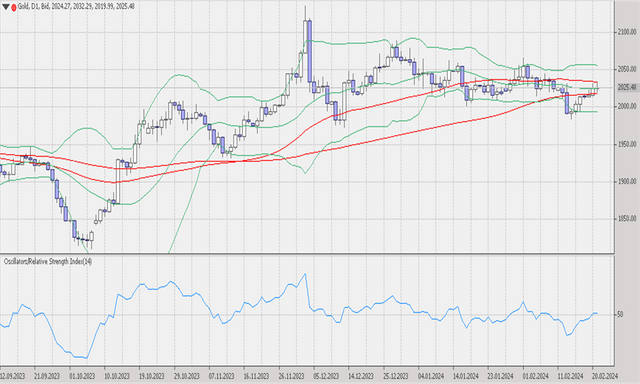
The price of gold on the daily timeframe is near the middle band line, it can be seen that the price is forming a Doji candlestick which reflects the indecision market.
In the last few days, the price of gold has tended to be bullish, but it seems that near the middle band line, the price is consolidating, if there is a breakout to the upside, the trend may continue to look for the next resistance.
Bollinger bands in this time frame form a flat channel with band distances that are not too wide, an indication of a sideways market, and perhaps the upper and lower bands act as resistance and support zones.
The MA 50 forms a flat channel near the price, an indication of a sideways market, and the RSI shows that the 51 level tends to be neutral even though it is 1 point above the uptrend level.

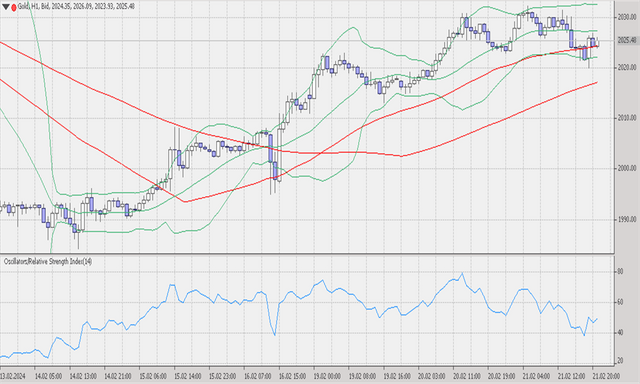
In the H1 timeframe, gold moves between the middle and lower bands. Here the Bollinger bands form a flat channel with a band distance that is not too wide, an indication of a sideways market.
The 50 MA forms an ascending channel some distance below the price and the lower band line is an indication of bullish momentum. Meanwhile, the RSI shows that level 49 tends to be neutral even though it is 1 point below the downtrend level.