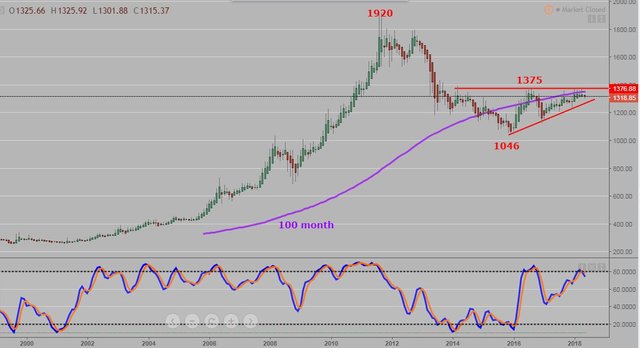
Here is the monthly chart of Gold going back to 2000 which depicts the major bull market and the decline since 2011.
It appears to have bottomed out at the 1046 level in December 2015 and has since trended up with resistance at the 1375 area.
The 100 month moving average may be a significant resistance level along with 1375.
Stochastics have reached the overbought area and will either continue up for a potential embedded position or may roll over...
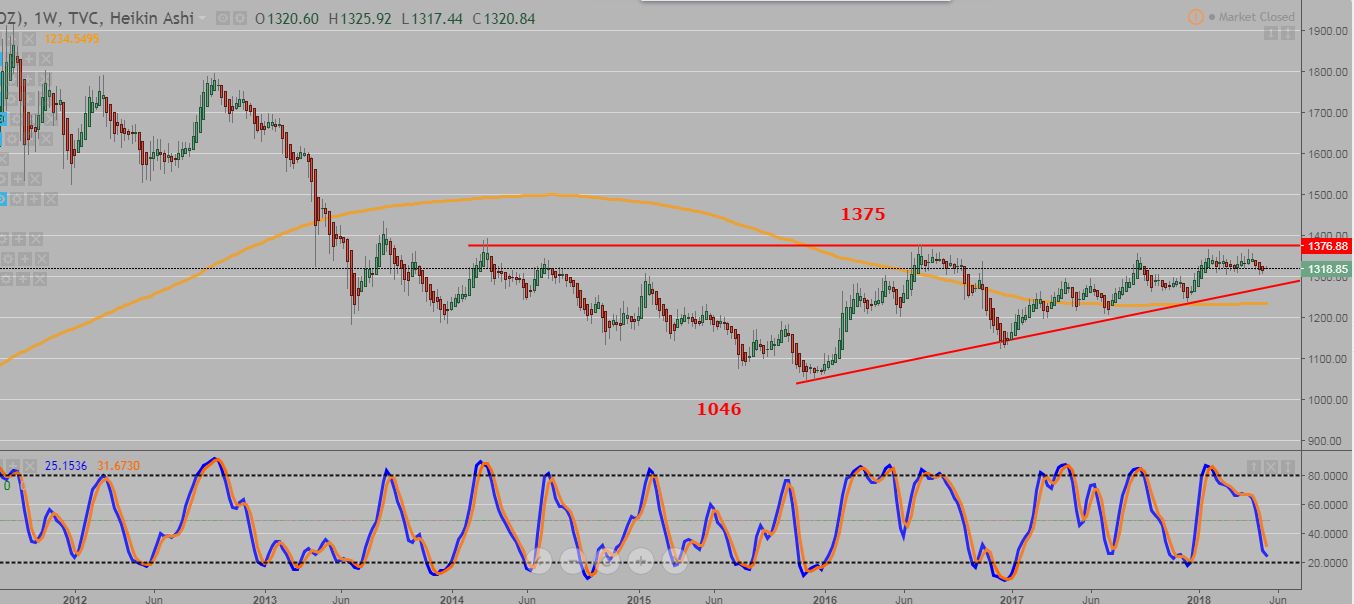
The weekly chart shows the trading range that it has been in for several weeks.
Most assets will either break up or down before reaching the end of an upwards wedge.
Stochastics are nearing the oversold area and appear to be leveling off.
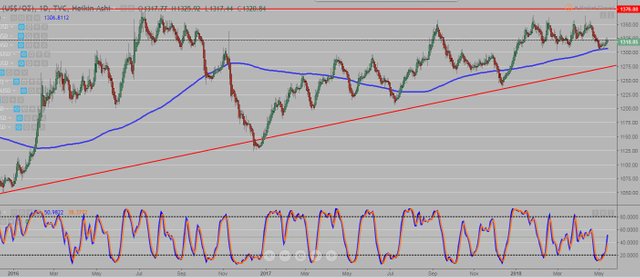
The daily chart shows support at the 200 dma, green heikin ashi bars and rising stochastics. All short term bullish trend.
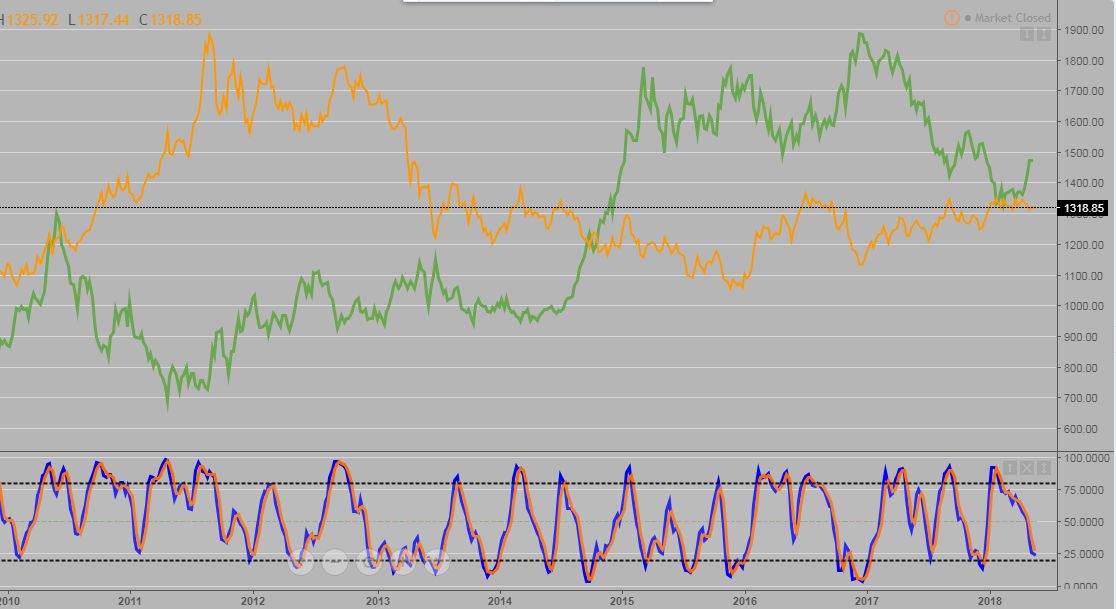
Here is a weekly line chart comparison of Gold (Orange line) and the US Dollar (Green line)
You can see their inverse relationship for the most part. Even though the USD has been on the rise, Gold has also moved up this week for a slight divergence.
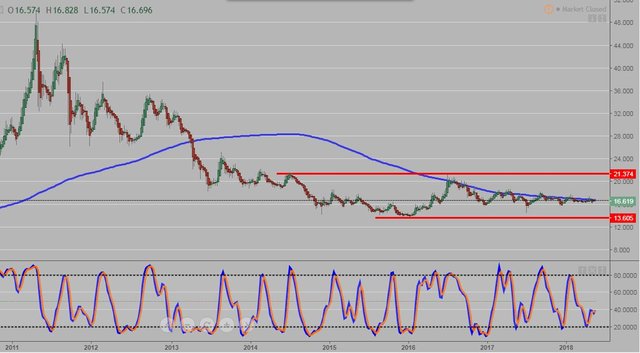
The weekly Silver chart shows the tight trading range that it is in.
The 200 dma appears to be the resistance level for months going back to 2016.
My speculation is that Gold will need to break up for Silver to move above the 200 dma.
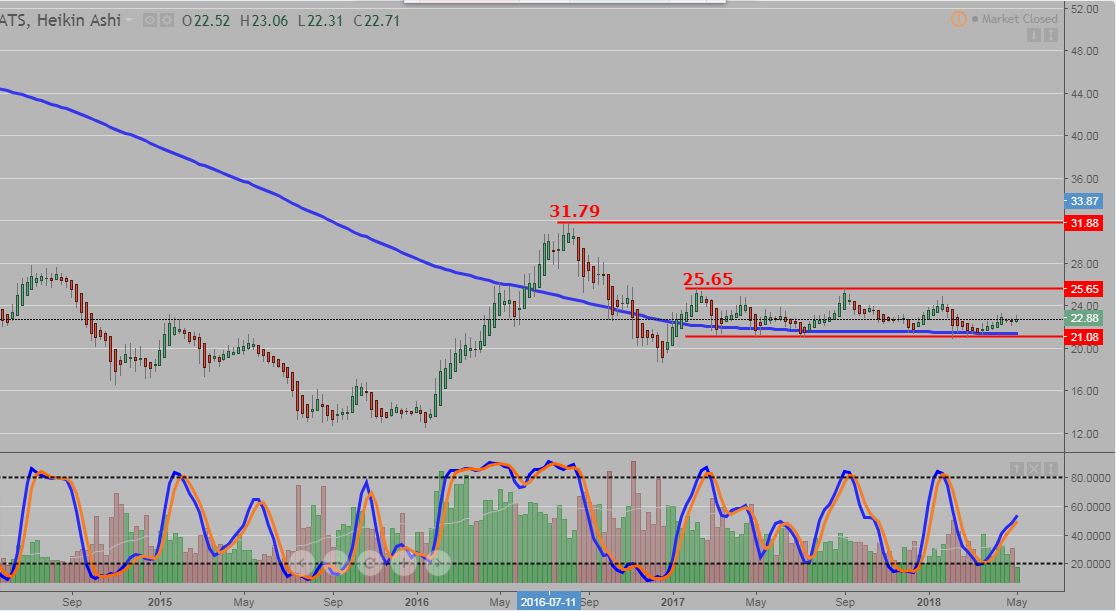
The weekly Gold and Silver miners ETF, GDX is also in a tight trading range
The 200 dma is providing support instead of resistance like Silver.
Again, Gold will need to break up in order for this ETF to move..
I do think that many investors in the precious metals markets have moved on as the market has not performed as anticipated. The 600+ billion TARP bailout program for the banks in 2008 'should' have provided the continued upside momentum for Gold. Add on the subsequent Quantitative Easing (QE) programs in the following years and the debasement of the US Dollar was set.
But like many assets that are trading on the comex and LBMA, there can be collusion between big banks and the price can be 'managed'... It may be years before Gold reaches the previous high of 1920 set in 2011, if it ever does...
Indeed,the precious metals market has not performed as anticipated,it is evident from the inverse relationship between the US dollar and gold
Downvoting a post can decrease pending rewards and make it less visible. Common reasons:
Submit
thanks for share gold,silver,GDX chart
Downvoting a post can decrease pending rewards and make it less visible. Common reasons:
Submit
Most valuable post sharing bro... Superb
Downvoting a post can decrease pending rewards and make it less visible. Common reasons:
Submit
You got a 1.99% upvote from @postpromoter courtesy of @glennolua!
Want to promote your posts too? Check out the Steem Bot Tracker website for more info. If you would like to support the development of @postpromoter and the bot tracker please vote for @yabapmatt for witness!
Downvoting a post can decrease pending rewards and make it less visible. Common reasons:
Submit