May 31, 2017
GOLD
Before discussing today's Monthly close, let's revisit what I published in August 2016 regarding Gold's Bull & Bear phases...
"Doesn't matter what analysts opine about with their market Bull vs Bear calls, it's just noise. And, I don't pay much attention to who they are, legend or not. Chart history speaks truth, not opinions. So here is the bottom line on Gold...
Gold's Primary Bull (accumulation phase) began at the Aug 99' low of $251. The current Secular Bull launched in Nov 04' when the Feb 96' $417 Lateral was taken out and held for several months. A Primary Bear began when in April 13' the $1522 low on a Descending Triangle off the $1921 high broke down magnificently beginning in the European-Asian markets, and that Bear continued until the Dec 15' low. We're now back in a Primary Bull phase since the 13' TrendLine was decisively breached in Feb 16' without a violation, with a Megaphone pattern. When and IF the 11' Trendline is decisively breached (currently at $1350'ish) and the $1921 High is taken out, Gold will re-assert its Secular Bull trend.
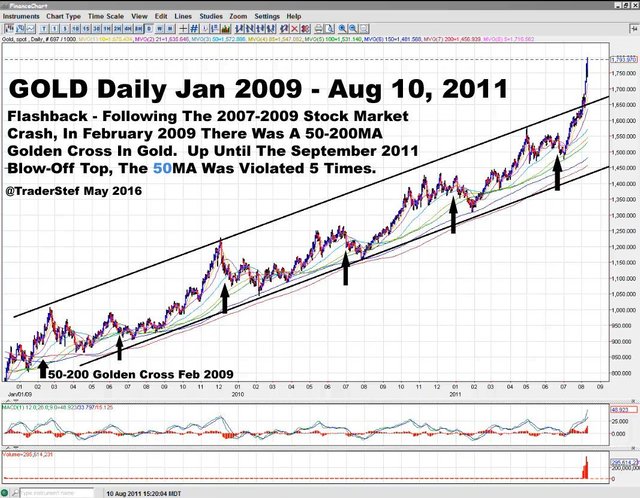
The most important time for the 50MA or EMA, is during a Primary Bull phase, following a 50-200 EMA Golden Cross, and a steady Channel asserts itself. A Golden Cross on the Daily took place in Feb '16 (Golden Cross on the Weekly has not yet occurred). The 50MA or EMA on the Daily may occasionally breach along the way, but does not mean we're back in a Bear Market. 50MA or EMA breaches are not 'Rare' in Primary Bull phases, as the 09'-11' channel clearly exhibits. Breaches are BTFD opportunities in a Primary Bull phase. What the MOMO Hedge Fund money is waiting for is a decisive breakout from the 2011 Trendline, and a Golden Cross on the Weekly. With all that said, 'Smart Money' has already entered and is accumulating due to NIRP & Gold Fundamentals."
The chart from my 2009-2011 Precious Hour archives, annotated for the August 2016 post...

For the record, Gold has not yet seen a Golden Cross on the Weekly chart, it has on the Daily.
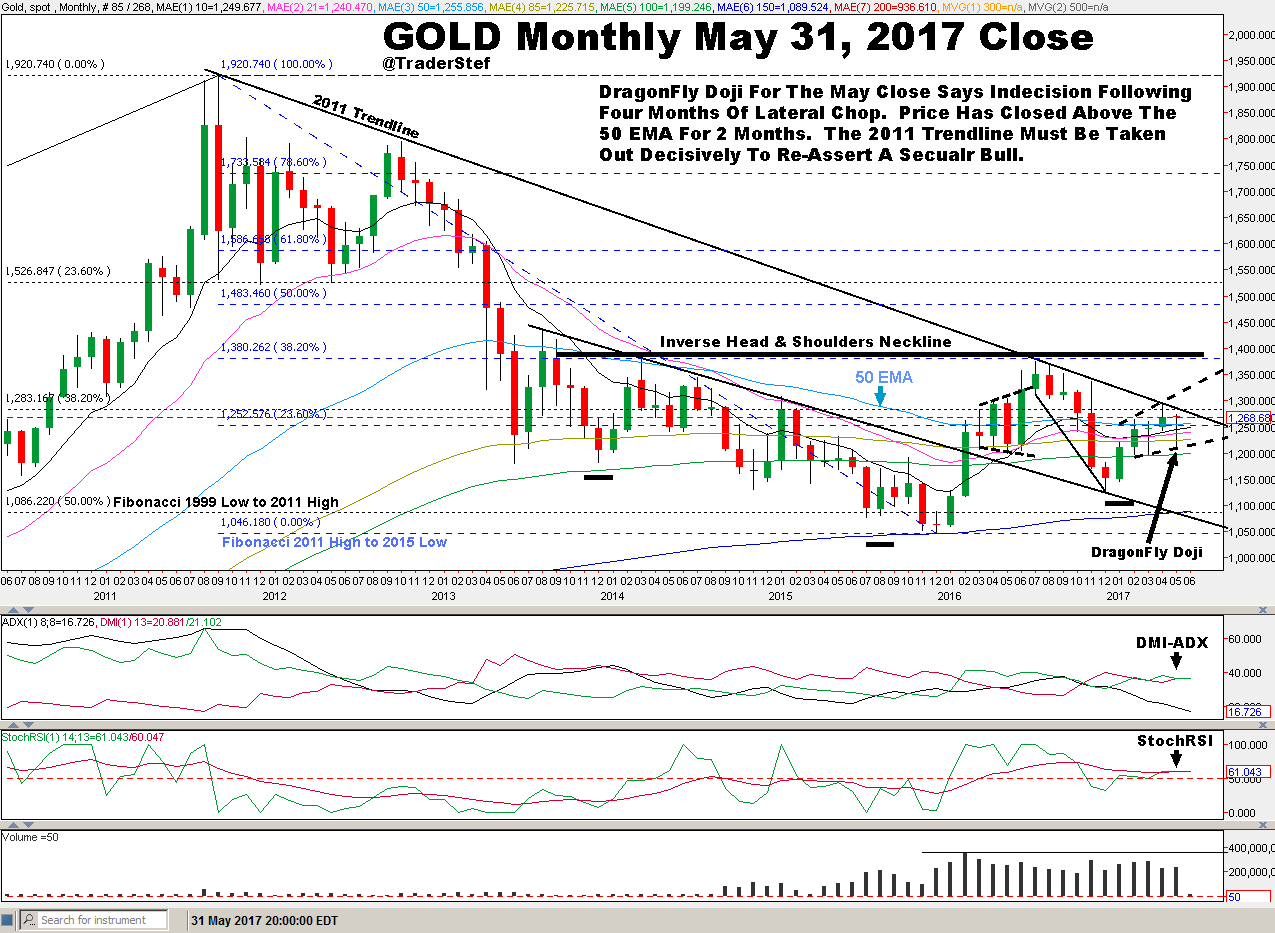
Here is the Monthly chart and analysis as of today’s 8pm EDT candlestick close…

Since February 2017 price has reached into & closed in a narrow range between the 23.6% Fibonacci at $1252 drawn from the 2011 High to 2015 Low, the all important 50 EMA now at $1255, and the 38.2% Fibonacci at $1283 drawn from the 1999 Low to 2011 High.
Just beyond all three of the aforementioned price levels, a stubborn Trendline drawn down from the 2011 High has been challenged several times. The longer it takes to be conquered, the lower the price point becomes. The current numbah is around $1280. If it is decisively taken out in price and volume, odds greatly improve for an upward RYPO that would complete the Right Shoulder of a potential Inverse Head & Shoulders pattern set-up that goes back to September 2013. Its Neckline is lateral to the 38.2% Fibonacci at $1380 drawn from the 2011 High to 2015 Low, creating a confluence of resistance before the next Fibonacci sitting at $1483. Another pattern developed within the Right Shoulder following the January $74 spike... an Ascending Broadening Wedge whose topside Trendline is sitting in-between the 2011 Trendline & the Inverse H&S Neckline. Allot going on!
Lastly, the candlestick print close for May 31 is a near perfect DragonFly Doji. They can be Bullish in some circumstances, but here with the 4 months of lateral chop along the 50EMA, it’s 50/50. So there you have it, flip a coin! The DMI-ADX and StochRSI studies are undecided. Volume is steady.
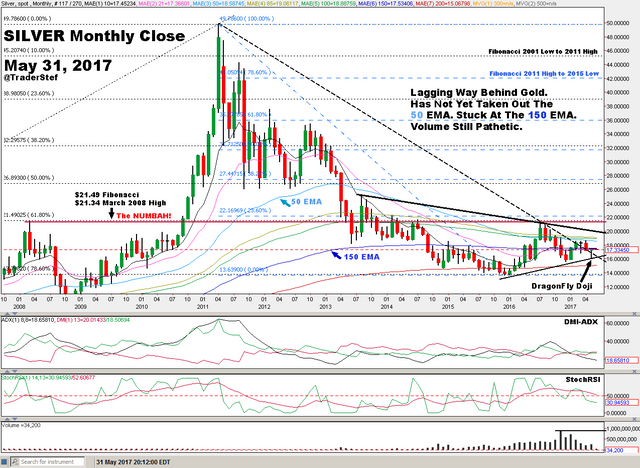
SILVER is still lagging behind Gold. The chart looks terrible. It hasn't taken out the 2013 Trendline or the 50EMA, no GoldenCross on the Daily, and not even close to the numbah that must be taken out decisively to re-assert a Secular Bull... $21.34-$21.49. Hey, it could happen in one day, week or monthly RYPO, but not lately.

Plan Your Trade, Trade Your Plan.
@TraderStef on Twitter https://twitter.com/TraderStef
Posted May 31 for @crushthestreet
Hi! I am a robot. I just upvoted you! I found similar content that readers might be interested in:
https://crushthestreet.com/articles/precious-metals/gold-breakout-flip-coin-silver-lagging-monthly-charts
Downvoting a post can decrease pending rewards and make it less visible. Common reasons:
Submit