This video was originally published 16/6/2019
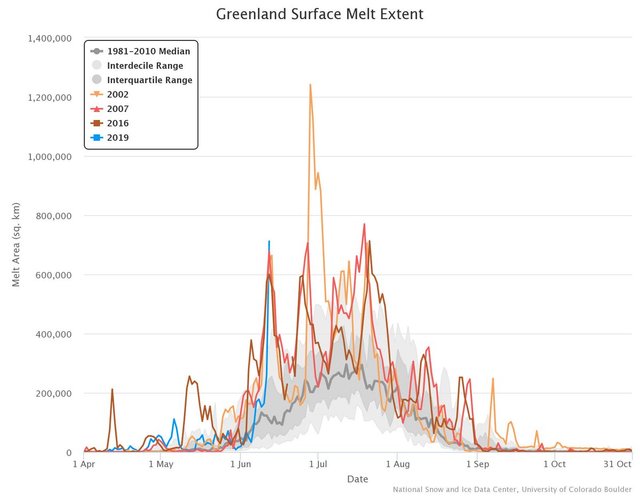
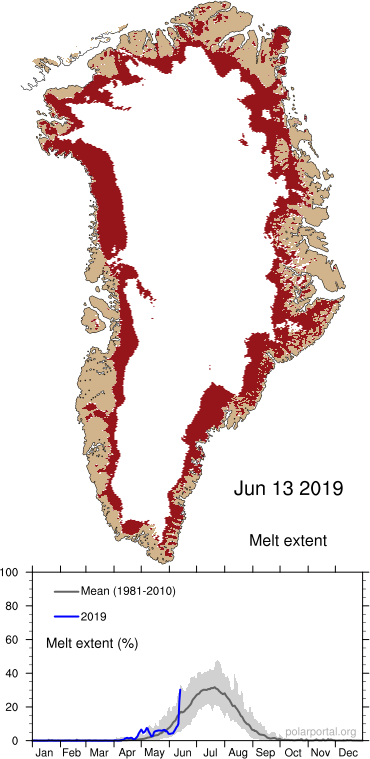
This report on Greenland ice surface mass budget is also kind of skewed in the news story by making it look as if there is massive melt, or never seen ice melt mass.

If you widen out that chart, you can clearly discern how much ice is being lost. Take note, white means neutral, or no loss; blue means a gain; and red means a loss. So, what do you think?

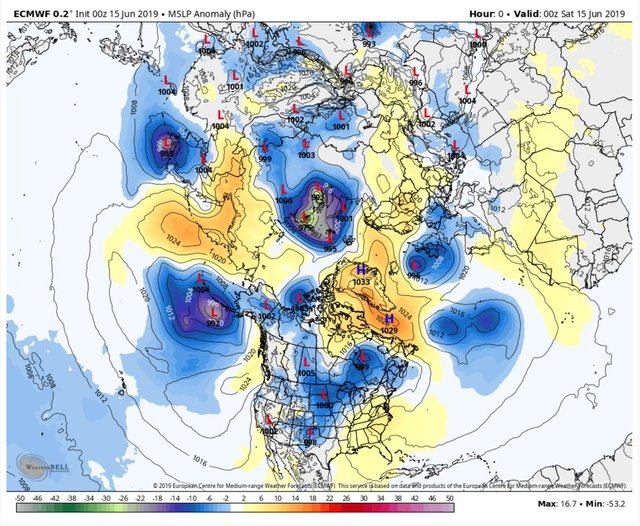
Again, William Colgan, PhD said that the automated weather station flipped a tenth or so degree above freezing, although, the big dome of high pressure has positioned itself over Greenland.
He also pointed out that this is a very rare event, which last occurred in July 2012. The truth is, this also occurred in 2007, so this is not so rare.

Moreover, The Washington Post used this graphic below, from ClimateReanalyzer, which is known for providing the hottest data set on the web. As you can see, even when they are showing the global temperatures at a tenth of a degree below normal, they still present this type of graphic to show you how hot the Arctic is. The rest of the globe, however, shows a tenth of a degree below normal.
It is not the warmest year ever, after all; because even the hottest data set on the web available for any news publication to prove Global Warming are showing a tenth of a degree below baseline.

Meanwhile, should we even look at the 80 degrees N. latitude to the Arctic Circle, the actual North Pole temperatures? Green line is the 45-year average from 1958–2002, while the red line represents the current temperature. Does it look like it is skyrocketing above anything? For me, it is at about the baseline, maybe that is why they did not touch this data.

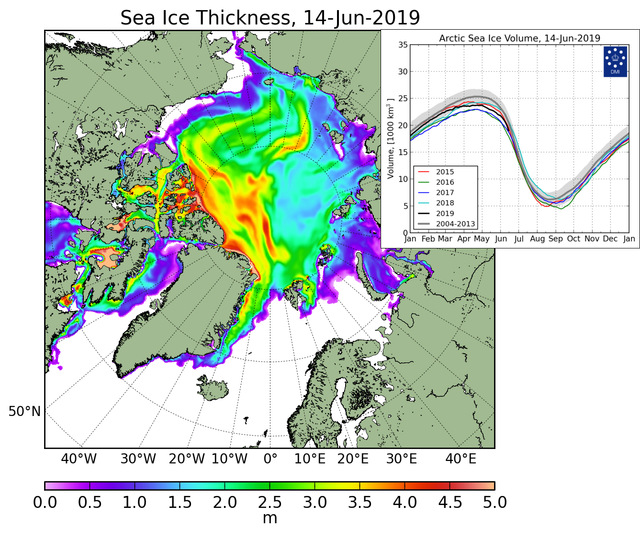
Going back to the stuff New Zealand article, they are now splitting a hair, looking for a gray area. Arctic sea ice is not at its lowest ever, so they have to cherry-pick the Chukchi and Beaufort seas because they are showing a little bit of anomaly. But further down, it says, “There is no indication that this year will be as low as 2012”.

Looking at this data set of Arctic Sea Ice Extent, this comes from several different data sets, EUMETSAT, OSI, and SAF, which can be found at osisaf.met.no. As shown in this graph, at least 2 years are running lower than the Arctic ice now, so it is not really the lowest ever.

Then, in this second data set for Arctic ice, do you still see two years with more ice melt than in 2019? I am shocked that they have bad fact-checkers on their editorial staff in New Zealand stuff.

But look at the graph below of the long-term Arctic ice melt from 2002 forward. Do you see any gargantuan runaway losses on the long-term averages?

The reason I brought that up is because of this statement they wrote in their article, “the extent of ice over the Arctic Ocean has never been this low.” New Zealand stuff needs to look for better fact-checkers, because if I can present two graphs from two separate datasets, coming from two different agencies showing otherwise, then there is a narrative in what they print.
Then they just conveniently leave a cover-up statement like “it may be messing with our weather.” They should be more responsible. Also, why include that polar bear invasion article link at the bottom? Is it to make people think that it was because it was low ice for the polar bears that is why they are in town, where in fact, there was too much sea ice? The ice was too deep for them to get to their feeding habitat; so, they went to the trash dumps and walked through cities.
They even added, “prompting local authorities to declare a state of emergency”, at the end of the line, for what? Is it to make people think that polar bears were in such a diminishing state? The way they put that article is so misleading.

More importantly, the whole Arctic was conveniently left out in reports about the Arctic Ice. They just cherry-picked basins within the Arctic that are showing anomalies. The thing is, if there is such a high-pressure system circulating air currents in those basins, what do you think is going to happen to the ice? The wind flow will move it to a different part of the Arctic.
Somehow, they left this logic out, and just switched from analyzing the whole Arctic, to regions in the Arctic that show decreasing ice mass.

With all this ‘selective’ news reporting, what do you think the chances are that the whole crew reporting about the Greenland and Arctic ice will say, the rings of Saturn are also affected by CO2? They should just look for more polar bear stories.

Thanks for reading, I hope you got something out of the article. If you like more information like this, I produce the tri-weekly Mini Ice Age Conversations podcast, 30 minutes of in-depth analysis on the GSM you can take on the go.
Mini Ice Age Conversations Podcast
iTunes: https://itunes.apple.com/us/podcast/adapt2030
Soundcloud https://soundcloud.com/adapt-2030
Libsyn http://adapt2030.libsyn.com/
(MIAC#234) Oligarchs Begin Cutting the Information Flow About Food Losses

For the bi-weekly Grand Solar Minimum climate update newsletter from myself, David DuByne, (ADAPT 2030) jump over to oilseedcrops.org you can enter your email and sign up. Move your mouse around for about 10 seconds and this box will pop up.
Join ADAPT 2030 NEWSLETTER http://www.oilseedcrops.org

“Help support the adapt 2030 channel on brighteon so we can keep Grand Solar Minimum information free to access.”
https://www.brighteon.com/channel/adapt2030
Support ADAPT 2030 by Visiting Our Sponsors
ADAPT 2030 & My Patriot Supply 2-Week Food Supply with 92 servings
www.preparewithadapt2030.com
True Leaf Market Heirloom Seeds ADAPT 2030 True Leaf Market Link
ADAPT 2030 Amazon Grand Solar Minimum Book Store https://www.amazon.com/shop/adapt2030
Upheaval: Why Catastrophic Earthquakes Will Soon Strike the United States https://amzn.to/2E7KbBt
*** Today’s Story Links ***
Be scared Greenland is melting during the melt season
https://www-m.cnn.com/2019/06/14/us/greenland-sudden-ice-melt-wxc/
https://edition.cnn.com/2019/06/14/us/greenland-sudden-ice-melt-wxc/?no-st=1560619709
Greenland Ice Spike graphics
Greenland melt extent
Greenland data
http://polarportal.dk/en/greenland/surface-conditions/
High pressure system
*** ADAPT 2030 Social Media Links ***
PATREON https://www.patreon.com/adapt2030
YOUTUBE ADAPT 2030 Mini Ice Age 2015–2035 Series on YouTube
BITCHUTE https://www.bitchute.com/hashtag/adapt2030/
BRIGHTEON https://www.brighteon.com/channel/adapt2030
STEEM https://steemit.com/@adapt2030
MINDS https://minds.com/ADAPT2030
MEDIUM https://medium.com/@globalcooling
FB https://www.facebook.com/Miniiceage
TWITTER https://twitter.com/adapt2030
STEEMIT https://steemit.com/@adapt2030