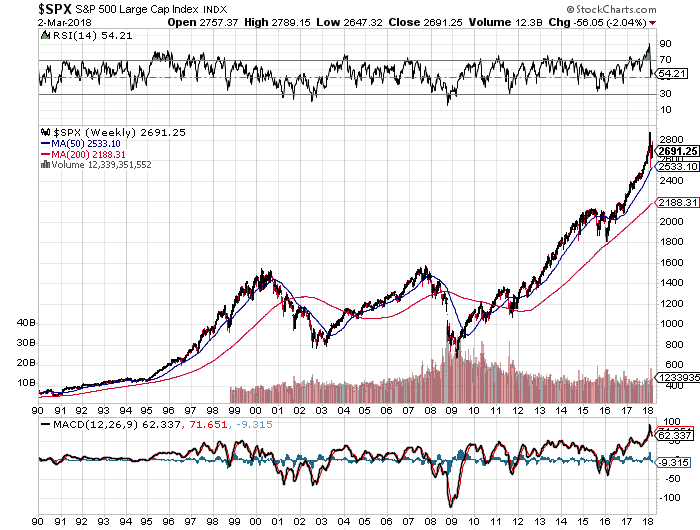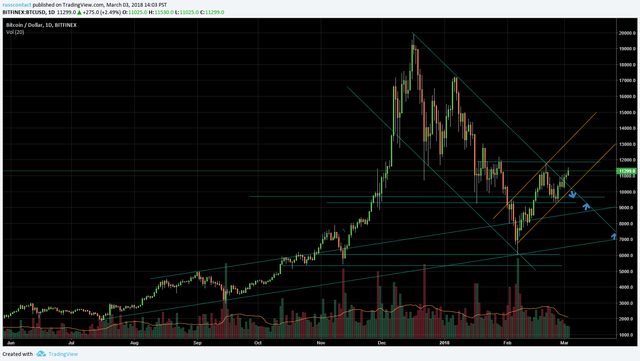
No, as you can see, it is the SPX. You can also see that the time frame is longer that the crypto ramp. Still the chart nearly matches crypto before the Jan/Feb bubble popped. Parabolical is parabolical. The the time frame of crypto is much compressed relative to other investments.
What I am trying to get over, is if you are invested in stocks, you had better watch out, and you might consider withdrawing or investing small amounts in another venue that is recovering as seen below?
I enjoyed this quote seen on Reddit today. Thomas Edison...... Fooling around with alternating current is just a waste of time. Nobody will ever use it. Remember this, every new innovation has great detractors that are proven to be wrong.
I also want to point out that "haejin" has many good posts for those wanting to learn to use trend line analysis.
This is not investment advice, I am not a professional advisor. Do your own research and
question everything.
I would love to hear your thoughts about Bitcoin and what altcoins you are interested in.
Please take the time to give me your up vote and follow by clicking on blogg in the header above.
thanks so much.
To the question in your title, my Magic 8-Ball says:
Hi! I'm a bot, and this answer was posted automatically. Check this post out for more information.
Downvoting a post can decrease pending rewards and make it less visible. Common reasons:
Submit