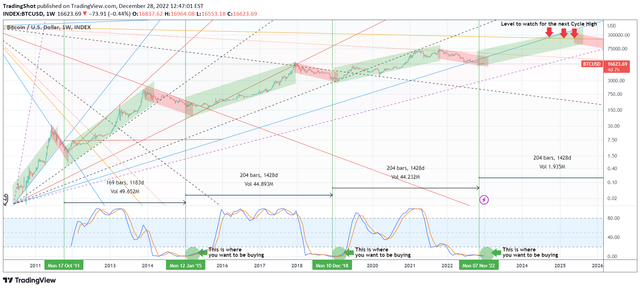
This is Bitcoin ( BTCUSD ) on the 1W time-frame. The current and past Cycles have been classified into Bull (green Channel) and Bear (red Channel). With an (unorthodox) use of the Pitchfan we identified the key trend-lines that have historically shaped both Bull and Bear Cycles and might continue to do so in the future.
The recent Bear Cycle has been driven by the 0.7 Pitchfan F (dotted). The new Bull Cycle should evolve around the 1.0 PF (solid blue) as the last two have mostly traded below their respective lines but peaked exactly after hitting them. This is of particular interest to us as the 1.0 (Bull Cycle) blue line leads to the 0.8 (Bear Cycle) orange line. Long-term investors should consider their crossing as the High of the next Bull Cycle may form there.
As to when to buy? Well where couldn't be a better time than now. The recent FTX low has been 1428 days since the bottom of the 2018 Bear Cycle, which is the exact same time as it took itself from the previous (2014) Cycle. Moreover the STOCH RSI is at the level where BTC historically bottomed and started the new Bull Cycle.
Do you think this is a unique long-term buy opportunity for Bitcoin and if so can the next top be near 200k? Feel free to let me know in the comments section below!