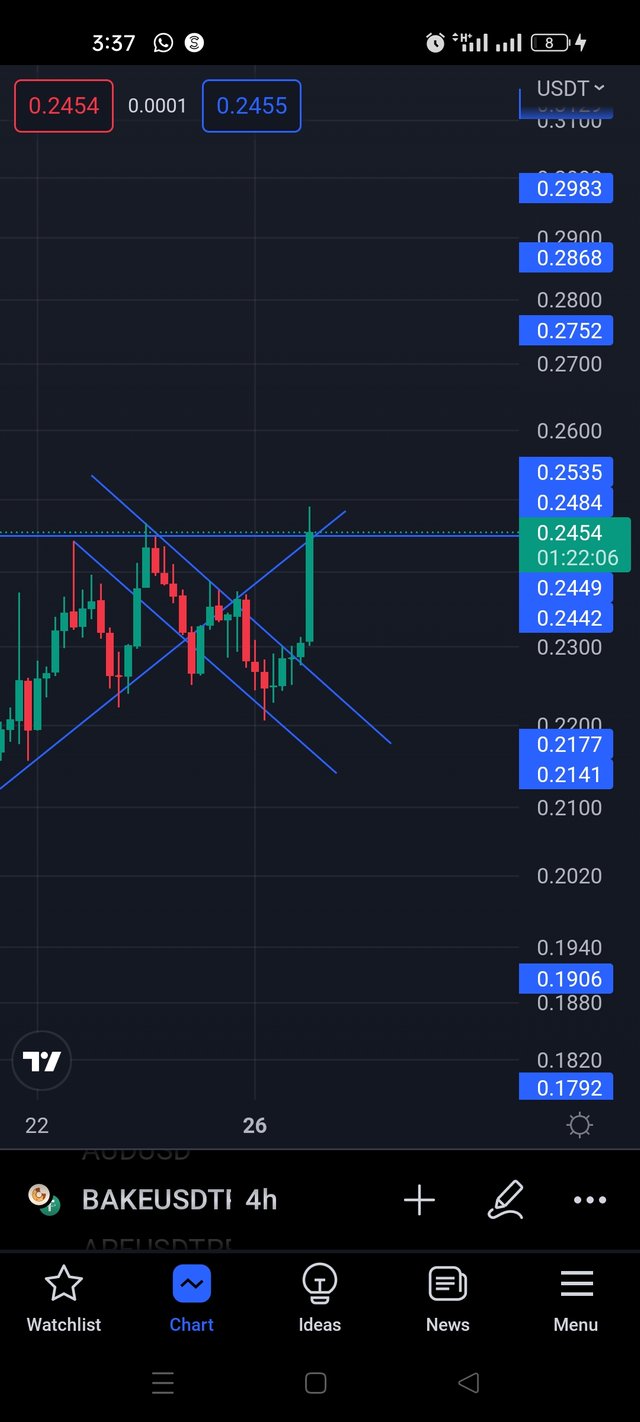
Hi everyone, the picture above is my analysis on Bake/usdt on 4hours candle chart.
After er formulating a rising wedge it actually break it out to make a correction at the top which actually went up to fill the next OB at the top. With this correct we should continue with the bearish moving.
My chart are always simple and straight forward I don't draw alot of lines, my analysis mainly based on trendline and I'm always getting it right. I will comeback and share the results
I stand to me corrected please.
Downvoting a post can decrease pending rewards and make it less visible. Common reasons:
Submit