DAX is quickly growing in popularity. Advanced Excel skills have moved beyond single table analysis with static data, to complex data modeling and analysis across multiple tables of data with live connection sources.
DAX, the language used in both Power Pivot and Power BI is, based on the existing Excel formulas. It also includes some new functions with added power and abilities. This can make DAX confusing when you start to use it. Even for those with experience, there is always more to learn and more creative ways to do things. So without further delay, here are my 6 DAX tips for Excel and Power BI users.
6 DAX Tips
1. Use measures to carry out calculations.
Avoid adding unnecessary calculated columns to a table as they just add to your model. It would be common for Excel user to be in the habit of adding new columns to existing tables. This is because old Excel had the ability to pivot only one table of data and so it was often necessary to add additional columns to the initial data. Adding new columns is a bad habit to carry over into Power Pivot or Power BI. Use measures instead. You can check out this article to get a better understanding of the impact of Measures over calculated columns.
2. Hide Unnecessary Columns
Hide all unnecessary columns from your client tools. By doing so, users can not aggregate columns in the wrong way. You will need to keep any columns by which you want to slice or filter your data. Most often these will be label type columns. Once you have created measures carrying out all the calculations you need, there is no need to keep the column in sight.
To hide columns in Power Pivot, select the columns you wish to hide. Right click and select Hide from Client Tools.
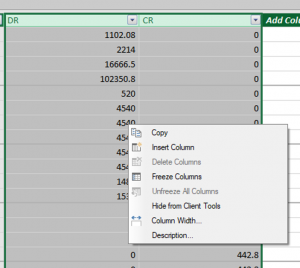
Once the columns have been hidden from client view, they will appear as grayed out within Power Pivot and when you create a pivot table, the columns will not be available.
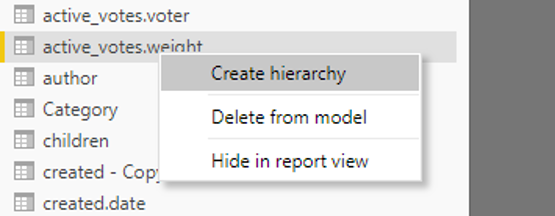
To hide columns using Power BI, the option to select is Hide in report view. This can be done from data view, selecting the column and right clicking. Or you can also do it from diagram view, select the column you wish to hide. Right click and select Hide in report view
3. Format Measures
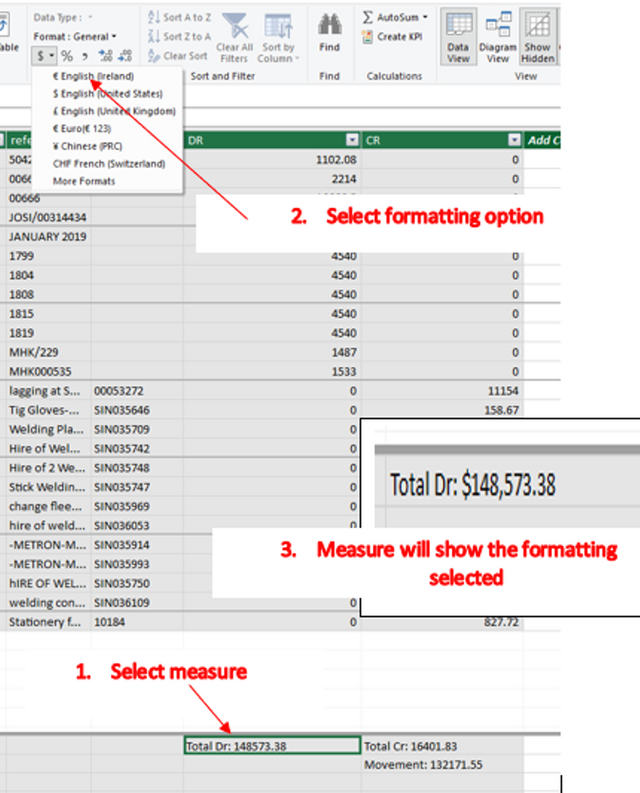
Always format your measure when you create it. For example, if you are working with financials and you know you will need your data to show in Dollars or Euros then set the formatting of the measure to the currency type. This way you only need to set the formatting once as it will carry into any pivot table or charts each time you select that measure.
To format the measure in Excel, select the measure in the calculation field of Power Pivot. Formatting options can then be selected from the Home ribbon. Once you select your formatting type, it will be applied to the measure in the calculation fields and any time you use it.
4. Write DAX like code
Use SHIFT Enter to move to a new line. This is another bad habit carried over from Excel. A habit I must admit I am finding hard to break myself. However, DAX is so much easier to read when it is written like code. Look at the following examples. Which one do you think is easier to read?
Total DR:=IF (NOT (ISFILTERED('tbl_date 1'[Date]) || ISFILTERED ( 'tbl_date 1'[Weekday] ) || ISFILTERED ( 'tbl_date 1'[Monthdaynumber] )),SUM ( Tbl_GL[DR]))
Or
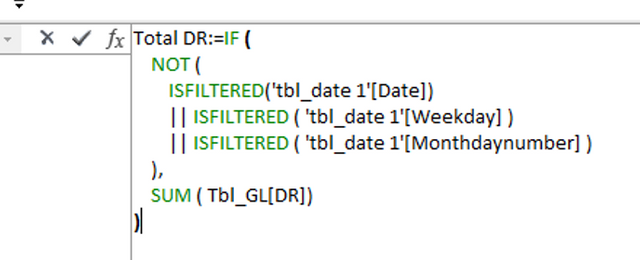
Not only are DAX formulas easier to read when you write them like code. But they are also easier to debug if you run into problems or errors.
5. Avoid data transformations steps using DAX.
Data transformation steps should not be carried out in Power Pivot where possible. For example, the use text functions such as TRIM, CONCAT, FIND and so forth used to transform text data to a more usable format. A common use would be to split the first and second names from one to two cells. Or even to join the first and second name from two cells to one. Data transformation and cleansing should be carried out with a different tool. A tool such as Power Query.
6. Keep the structure of the model simple.
Star schema as shown below works best. This is where there is one Facts table and each dimension table is connected directly to the fact’s tables.
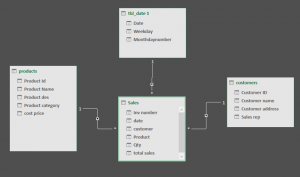
A Snowflake schema will have dimensions tables connected to other dimensions tables. Just like the example image below. Snowflake structures can be transformed into a star structure easily using Power Query.
SIGN UP FOR OUR NEWSLETTER TODAY – GET EXCEL TIPS TRICKS & LEARN AND EARN ACTIVITIES TO YOUR INBOX
SIGN UP
Cross posted from my blog with SteemPress : https://theexcelclub.com/6-dax-tips-for-excel-and-power-bi-users/
It's been some time since you did a DAX article Paula. I have missed these. All the tips provided are great and it is hard to pick a favorite. If people could stick to these tips, it will save them a lot of time and heartache.
Downvoting a post can decrease pending rewards and make it less visible. Common reasons:
Submit
#posh shared on twitter https://steemit.com/hive-102332/@theexcelclub/6daxtipsforexcelandpowerbiusers-id578fhw5u
Downvoting a post can decrease pending rewards and make it less visible. Common reasons:
Submit