This is my homework post for Steemit Crypto Academy Season 21 Week 6, Combining Multi-Timeframe Analysis with Market Cycles.
Note :
- I am not a professional trader. What I have written in this article is theoretical, based on various sources I have read on the internet. By participating in assignments at Steemit Crypto Academy, I feel that I have gained a lot of theoretical knowledge in understanding the asset market (especially crypto) and also topics related to blockchain. Thank you for this opportunity.
- I performed this task on Windows 10 PC, Google Chrome.
Question 1: Understanding Market Cycles Explain the four key phases of market cycles (accumulation, expansion, distribution, and contraction) and their significance in cryptocurrency trading.
1.1. Understanding Market Cycles
Market cycle theory basically describes the interaction relationship between traders' or investors' emotions and market conditions. The relationship between the two will form a price pattern that repeats in the trading. Not only in crypto trading, this theory also applies to all other assets trading. This cycle is more visible in trading on assets that have high volatility, including cryptocurrencies.
The theory of market cycles was not developed by a single individual, it found its form through the history of trading and the contributions of various trading activists since Charles Dow (19th century), Ralph NElson Elliot (1930s), Richard Wyckoff (1920s to 1930s) and other figures such as Daniel Kahneman and Amos Tversky who studied how human psychology affects their investment decisions (behavioral economics, 1970s to 1980s). However, the most popular version of the market cycle theory is that suggested by Wickoff, namely Accumulation > Markup > Distribution > Markdown, famous as Wickoff Market Cycle.
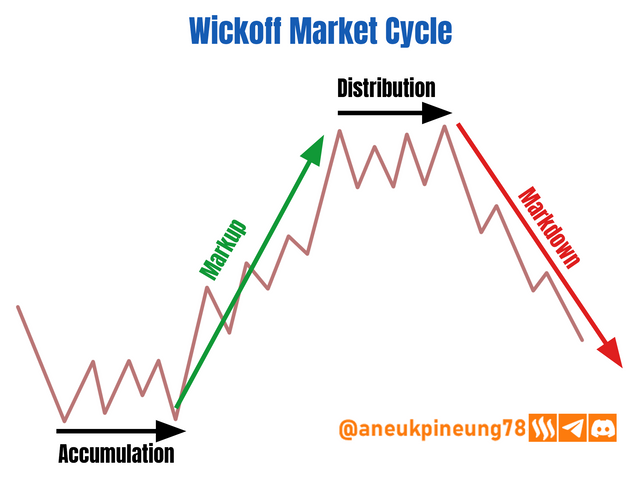
There are 4 key phases in the market cycle theory, namely:
- Accumulation. The accumulation phase begins at the end of a bearish trend, at which point the asset price stabilizes at its lowest level. Trading volumes are low due to low market interest. Here the price goes sideways, and indicators such as RSI will show an oversold position. In this phase, savvy investors start buying the asset in the hope that the price will rise soon. In general, the market does not show confidence in the asset.
- Markup (Expansion). After some times in the oversold conditions, influenced by the continuous buying (accumulation) of clever investors, the trend begins to show a reversal, attracting more investors so that the price also strengthens, which causes the trading volume to increase due to the influx of new liquidity into the market. In this phase, market optimism increases towards the asset. Higher highs and higher lows continue to be made during this phase.
- Distribution. In this phase, the asset price reaches a peak, and selling pressure appears. Smart investors start selling. The trading volume is very high mainly because of the simultaneous buying and selling. In this phase, investors who play with emotions are in danger of falling victim to their own denial and expectations that contradict the market fact that “prices will continue to go up”. In the distribution phase, prices move sideways and fluctuations are at a high level. Indicators such as MACD and RSI will show bearish divergence.
- Markdown (Contraction). At the end of the distribution phase, when the price drops dramatically, the markdown phase has officially started a bearish trend. In this phase, retail investors will usually start selling at a loss. The psychological state that covers some retail investors who realize the end of the bullish phase too late is formed and dominates in this phase, namely fear, despair, and disappointment. Lower lows and lower highs are formed. Indicators such as RSI will show oversold conditions.
1.2. Market Cycle and Market Psychology
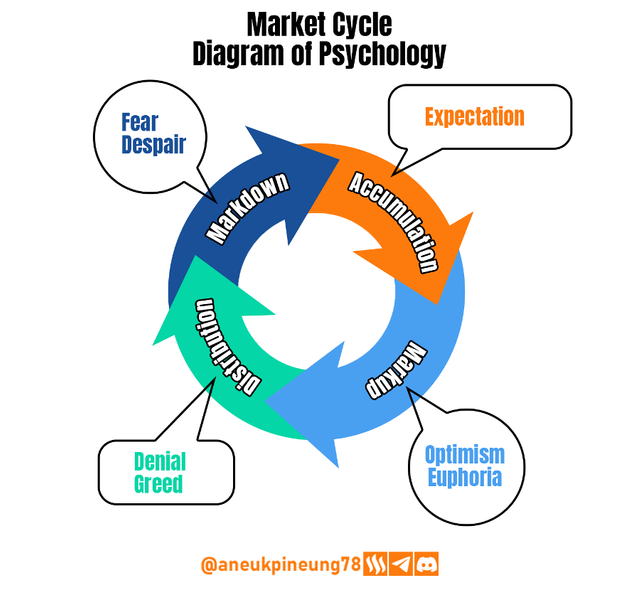
Market cycle theory has always been associated with the psychological state of market participants at each phase, and the classic diagram of it is as follows:
- Accumulation: Expectation.
- Markup: Optimism, Euphoria.
- Distribution: Denial, Greed.
- Markdown: Fear, Despair.
The following figure shows the phases in the Market Cycle theory and the market psychology conditions that form in each phase. I created the image based on various references on the internet.

Question 2: Applying Multi-Timeframe Analysis Demonstrate how multi-timeframe analysis can be used to identify trends and reversals during different market cycle phases. Use examples from Steem/USDT charts.
As the name implies, multi-timeframe analysis is a strategy that involves looking at price charts on multiple timeframes and is meant to get a more comprehensive picture of market conditions. This approach can prove to be very effective and useful for identifying market cycles and directional changes at various phases in the market cycle. With it, investors can make their moves in the market with more confidence.
In practice, multi-timeframe analysis is done by setting a main and supporting timeframe. The main timeframe (larger timeframe) is used to monitor the broad market trend, while the supporting timeframe which is a smaller timeframe is used to get more specific entry and exit signals. For example, a trader who trades on intraday trading will use the weekly timeframe as the main timeframe and the daily timeframe as the supporting timeframe.
Let's take a look at the following images showing the latest price chart of the STEEM/USDT pair on the Binance spot market in various timeframes.
- The first image is a screenshot of the 1-week timeframe, which shows that since 5 weeks ago STEEM/USDT has been in a Markup (bullish) position.
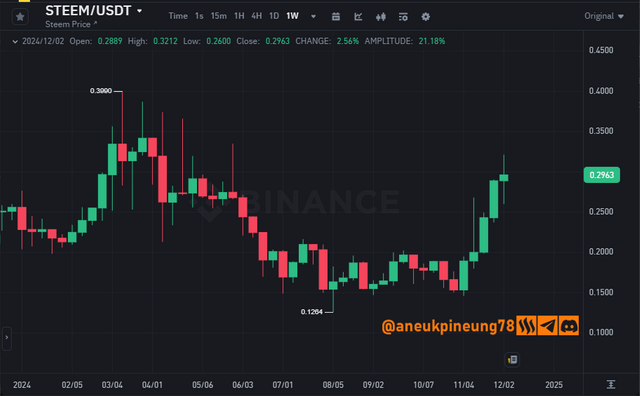
STEEM/USDT in 1 Week timeframe as seen on Binance Spot Market on binance.com
Image is clickable and might show larger resolution. - The second image is a screenshot for the 1-Day timeframe where it can be seen that the price is still trending upwards when compared to 33 days ago, but since 2 days ago the chart began to show a reversal.
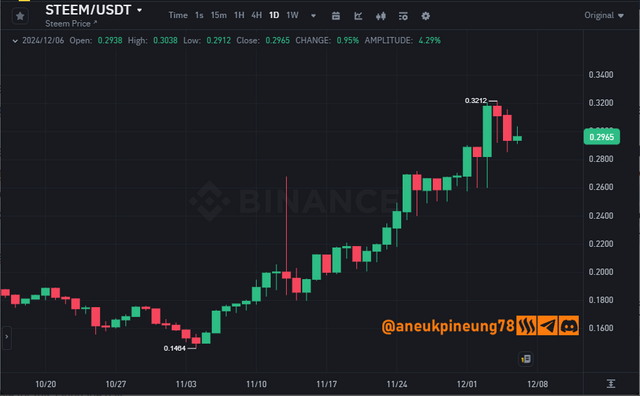
STEEM/USDT in 1 Day timeframe as seen on Binance Spot Market on binance.com
Image is clickable and might show larger resolution. - On the 4 Hour timeframe as seen in the third image, since 2 days ago the chart looks to have the price go sideways.
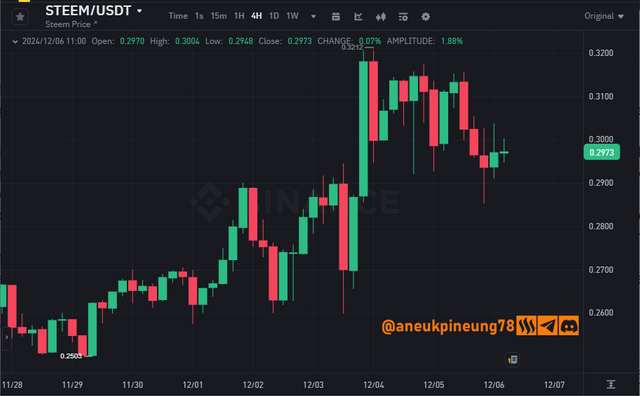
STEEM/USDT in 4 Hours timeframe as seen on Binance Spot Market on binance.com
Image is clickable and might show larger resolution. - The 1-hour timeframe (Figure 4 below) shows that since 12 hours ago the price has moved sideways after experiencing a decline started 19 hours ago.
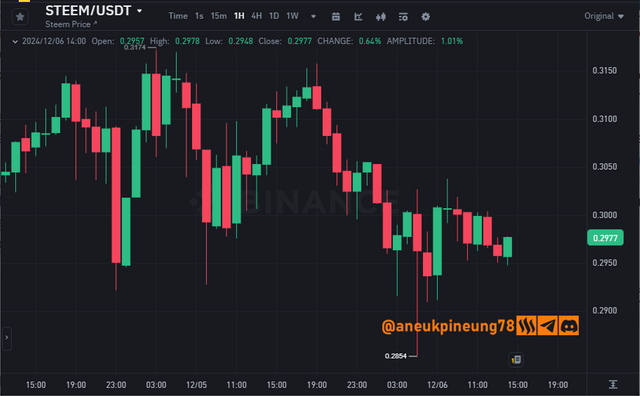
STEEM/USDT in 1 Hour timeframe as seen on Binance Spot Market on binance.com
Image is clickable and might show larger resolution. - Observations on the 15-Minute timeframe (Figure 5) obtained information that since 9 hours ago the price is still showing an upward trend even though since 4 hours ago it has been moving sideways with the latest signal of the possibility of going up again (indicated by the last two green candles).
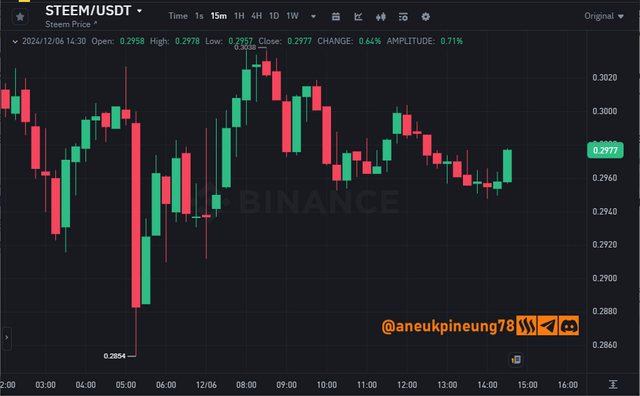
STEEM/USDT in 15 Minutes timeframe as seen on Binance Spot Market on binance.com
Image is clickable and might show larger resolution.
The provisional conclusion from observing the STEEM/USDT pair on the Binance spot market is that, in general, on observations in the high timeframe, STEEM/USDT is still in the Markup phase, with the possibility of a change in direction soon as indicated by the smaller timeframe where the price starts to move sideways, something that is often seen when the market is about to enter the next phase in market cycle theory.

Question 3: Combining Market Cycles with Multi-Timeframe Analysis Show how to align multi-timeframe analysis with market cycles to refine your trading strategies. Highlight how these tools complement each other in volatile markets.
Armed with the conclusions we have reached on the observation of the STEEM/USDT pair as above, we can continue the analysis using the theory of market cycles to understand approximately what phase the market is currently in and what tendencies it has (continuing the phase or getting ready to start the next one).
Let's analyze the market cycles on the various timeframes we used earlier, armed with a screenshot of the STEEM/USDT pair price chart as seen on the Binance spot market.
- The 1-Week timeframe shows that the STEEM/USDT market is in the Markup phase and this has been the 5th week of this phase.
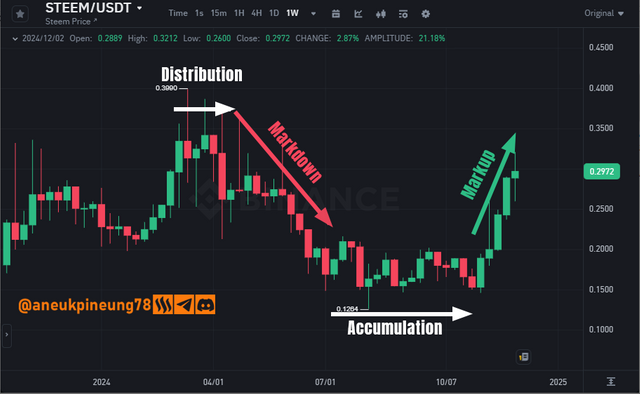
Image is clickable and might show larger resolution. - The 1-Day timeframe provides information that since the last 3 days there has been a downward trend in prices.
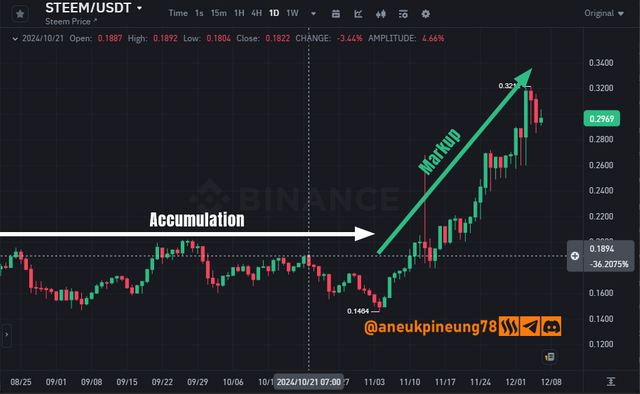
Image is clickable and might show larger resolution. - A more detailed picture on the 4-Hour timeframe shows the occurrence of sideways price movements since breaking through the highest number (USDT 0.3212) until now in this bullish period.
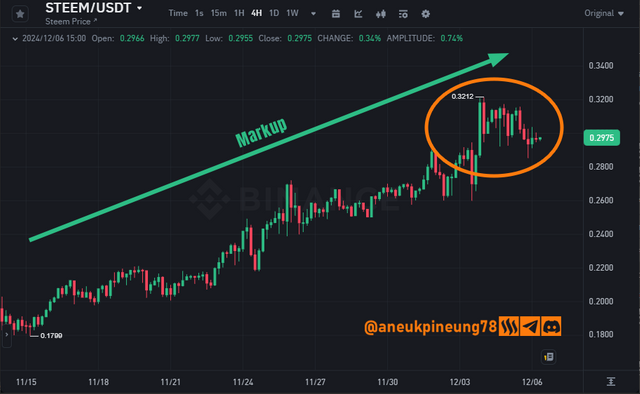
Image is clickable and might show larger resolution. - The 1-Hour timeframe confirms that the price has been moving sideways, and the formation of a signal to watch out for is the formation of a lower low within the sideways movement.
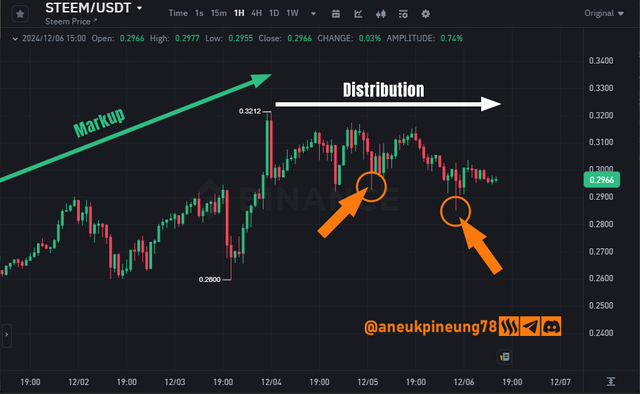
Image is clickable and might show larger resolution. - The 15-minute timeframe shows the tendency of the price to continue to decline within the sideways movement.
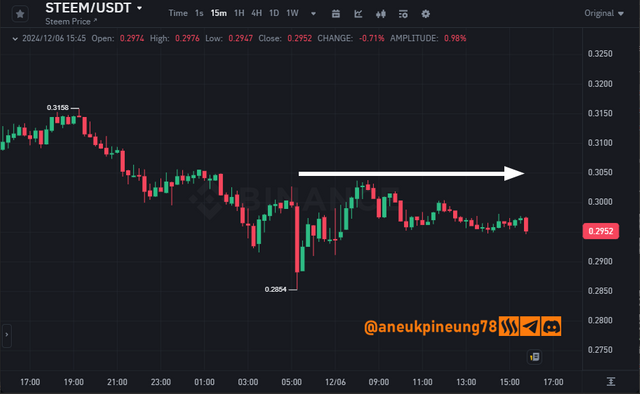
Image is clickable and might show larger resolution.

Question 4: Developing an Advanced Trading Strategy Create a trading strategy for Steem/USDT that integrates market cycle phases and multi-timeframe analysis. Specify your entry, exit, and risk management criteria.
4.1. Integrating Market Cycle Phases And Multi-Timeframe Analysis
- Regarding the utilization of market cycle theory and multi-timeframe analysis in building a backup strategy, of course, a trader should pay attention to the market cycle on various timeframes. When the market is in the accumulation phase following a markdown and the price is stabilizing at the lower level with sideways movement, I will wait for signals of a phase change. The following screenshot shows an effective 1-week timeframe for reading market cycles. When the market is in the accumulation phase, the opportunity awaits at the end. Observant traders will be prepared for a bullish reversal.
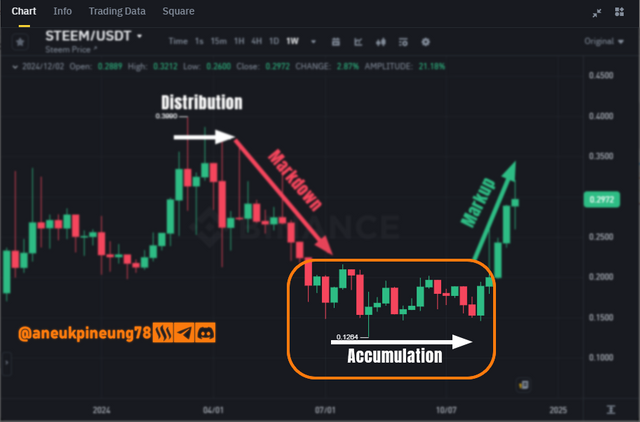
Image is clickable and might show larger resolution. - After getting the first signal of a possible bullish reversal or markdown phase as seen on lower timeframes (e.g. 1-Day), I will use additional analysis tools for further confirmation, e.g. Moving Averages (MAs) and Relative Strength Index (RSI).
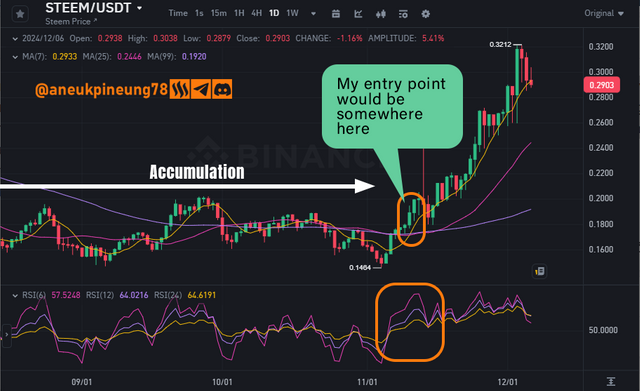
Image is clickable and might show larger resolution.
4.2. The Entry, Exit, And Risk Management Criteria
- Entry Criteria. As seen in the previous figure, after receiving a phase change signal, confirmation is done using two technical analysis tools, RSI and MA. A positive signal was first signaled by the RSI and a week later the MA made a Golden Cross, which is already two signals and I think it's a strong enough signal as an entry point. I will enter at the moment after the Golden Cross is formed.
- Exit Criteria. Realizing that the market is embarking on a Markup or bullish phase, I will not be too worried about the price upheaval although I will still monitor the developments, but this time I believe that the bullishness will not be short-lived. At least the phase theory in the market cycle should find its perfect form. So, I will set a plan to exit when the market forms a distribution phase, and I will steadily exit when the technical analysis tools indicate and confirm each other's “bad news”. And of course, that observation must be made through a lower timeframe (in this case 1-Day) as seen in the following image. I will very likely exit the market when the RSI shows a Bearish Crossover (Bearish Momentum), and I will DEFINITELY exit when the MA shows a Golden Cross. It is certain that the market is already in the next phase when this two Cross confirm each other.
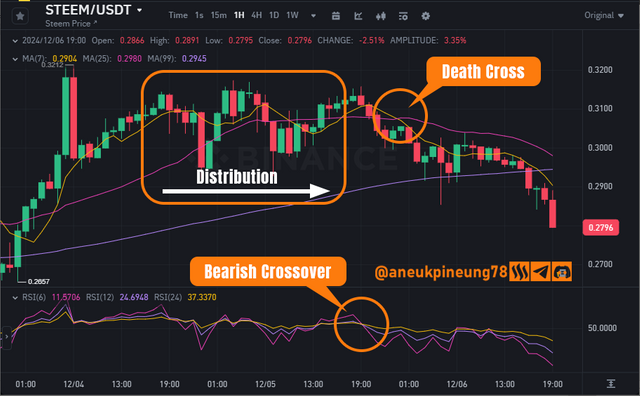
Image is clickable and might show larger resolution. - Risk Management. The cryptocurrency market is a highly volatile market, the market is never completely certain, therefore good risk management is necessary to avoid losses. Here are some of the risk management strategies that I will use:
- Stop-Loss. This is probably the most popular risk management strategy. In this case, where I'm in a buy position, I would place the Stop-Loss slightly below the nearest support level.
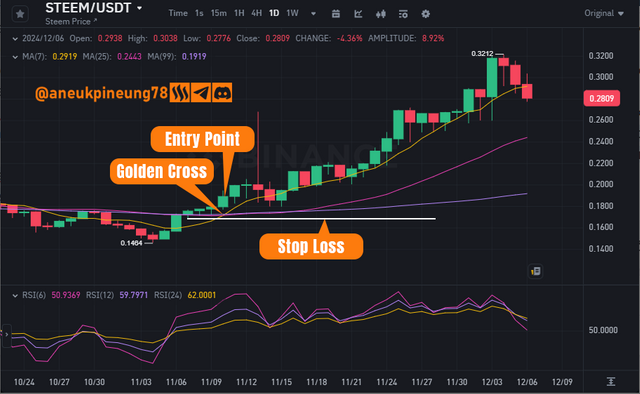
Image is clickable and might show larger resolution. - Risk-Reward Ratio. Any observant trader will make sure that every trade he enters has a greater profit potential than risk (for example, 2:1 or 3:1). In Multi-timeframe trading, large timeframes are used to identify long-term profit targets and small timeframes to determine profitable entry points.
- Avoid over trading by limiting the number of trades per day or week to avoid over-exposure to the market, and focusing only on high-quality signals based on multi-timeframe analysis, ignoring any minor price movements.
- Stop-Loss. This is probably the most popular risk management strategy. In this case, where I'm in a buy position, I would place the Stop-Loss slightly below the nearest support level.

Question 5: Mitigating Risks in a Volatile Market Discuss how to manage risks and avoid false signals when trading across multiple timeframes during different market cycle phases.
Trading risk can be managed in several ways including the ones we have discussed above. For sure Stop Loss will be very important because a good trade is not only one that brings profit and profit also does not only have to mean selling above the purchase price, but profit also means not losing more.
About false signals, in multi-timeframe trading, this can be avoided by applying a few things, including:
- Confirmation of signals between timeframes, the theory is “signals on small timeframes are more valid if they match the trend on large timeframes”. So if the 1-week timeframe shows the continuation of the uptrend, then the uptrend signal on the 1-day timeframe is more reliable, and traders should focus only on buy signals.
- Indicators such as Moving Averages, Average Directional Index (ADX), or Price Patterns can be used to confirm the direction of the trend on large timeframes.
- Combine indicators such as Moving Averages (MA), RSI/Stochastic, and Volume, to filter out false signals and noise.
- Filter the signals. Don't enter the market just because you see a signal. Make sure there is support from indicators, technical levels, and large timeframe context.

Thanks
Thanks @crypto-academy for the lesson.
Pictures Sources
- The editorial picture was created by me.
- Unless otherwise stated, all another pictures were screenshots and were edited with Adobe Photoshop 2021.
Sources and Reading Suggestion
- https://www.foreximf.com/blog/multiple-time-frame-analysis-trading-forex
- https://id.tradingview.com/scripts/multi-timeframe/
- https://tradeciety.com/how-to-perform-a-multiple-time-frame-analysis
- https://www.seputarforex.net/artikel/cara-trading-multi-time-frame-dengan-stochastics-286100-31
- https://www.seputarforex.net/artikel/strategi-scalping-menggunakan-mta-multiple-timeframe-analysis-299282-31
- https://www.babypips.com/learn/forex/multiple-time-frame-analysis
- https://www.litefinance.org/blog/for-beginners/trading-strategies/trading-3-time-frames/
- https://www.investopedia.com/terms/m/market_cycles.asp
- https://www.investopedia.com/trading/market-cycles-key-maximum-returns/
- https://www.newtraderu.com/2022/05/30/what-are-the-4-market-cycles/
- https://www.xs.com/en/blog/wyckoff-accumulation/
- https://en.wikipedia.org/wiki/Stock_market_cycle
- https://corporatefinanceinstitute.com/resources/economics/market-cycle/
- https://www.gresham.ac.uk/watch-now/market-psychology
- https://www.investopedia.com/terms/m/marketpsychology.asp
- https://www.forbes.com/sites/danirvine/2024/06/30/market-psychology-understanding-emotional-drivers-of-market-trends/
- https://www.5paisa.com/finschool/stock-market-psychology/


https://x.com/aneukpineung78/status/1865200438385275104
Downvoting a post can decrease pending rewards and make it less visible. Common reasons:
Submit
Hello friend greetings to you, hope you are doing well and good.
Market moves in phases and you have defined them all very beautifully. The STEEM Charts are amazing. According to me we are in uptrend phase of the market, the accumulation phase has just finished. I can see steem more bullish because it has too much below from it's all time high. Even if it goes up and touch half of it's all time high it can give us 10x to 15x.
I wish you best of luck in the contest dear friend. Keep blessing.
Downvoting a post can decrease pending rewards and make it less visible. Common reasons:
Submit
Yes. This is a happy time, I guess. Good luck to you, too.
Downvoting a post can decrease pending rewards and make it less visible. Common reasons:
Submit
Bingung mau mengatakan apa.. saya doakan semoga sehat selalu dan jangan pernah bosan berbagi Informasi dan artikel untuk kami bang. Mantap
Downvoting a post can decrease pending rewards and make it less visible. Common reasons:
Submit