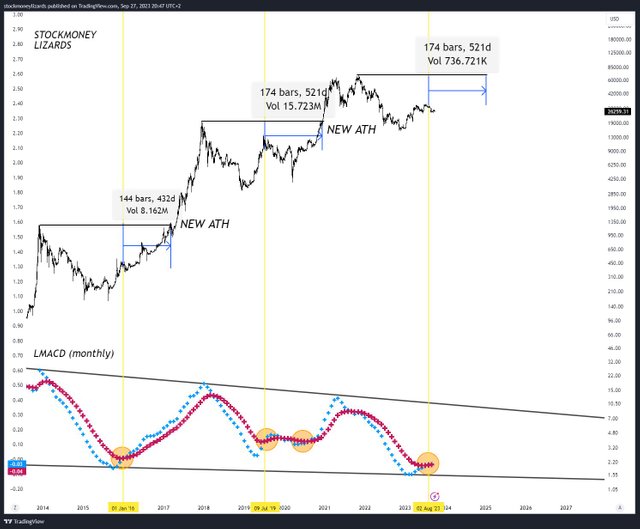
It's interesting that after monthly MACD golden crosses occured, the Bitcoin(BTC) prices broke the previous ATH(All Time High)s within 1.5 years.
Now, the monthly MACD has a golden cross. If it follows the previous patterns, the BTC price will break the previous ATH within 1.5 years from now. It means that it's possible for BTC to break $69k within Feb 2025.
Well, it looks like that the time for waiting the next bullish market will be boring. However, I won't give up. I believe that I will catch the opportunity to win this cycle.
Upvoted! Thank you for supporting witness @jswit.
Downvoting a post can decrease pending rewards and make it less visible. Common reasons:
Submit
Taking a look at BTC's monthly MACD chart reveals intriguing insights into the cryptocurrency market's trends. As investors analyze this powerful indicator, the question arises: Are we witnessing a potential bullish or bearish momentum shift? While the charts hold the key to this puzzle, it's equally important to plan for upcoming events like Halloween. Some enthusiasts might even consider hiring los angeles magician for halloween festivities, adding a touch of magic to their celebrations while keeping a close eye on Bitcoin's market movements.
Downvoting a post can decrease pending rewards and make it less visible. Common reasons:
Submit
Got a lot of knowledge after reading this hope you share more.
Downvoting a post can decrease pending rewards and make it less visible. Common reasons:
Submit