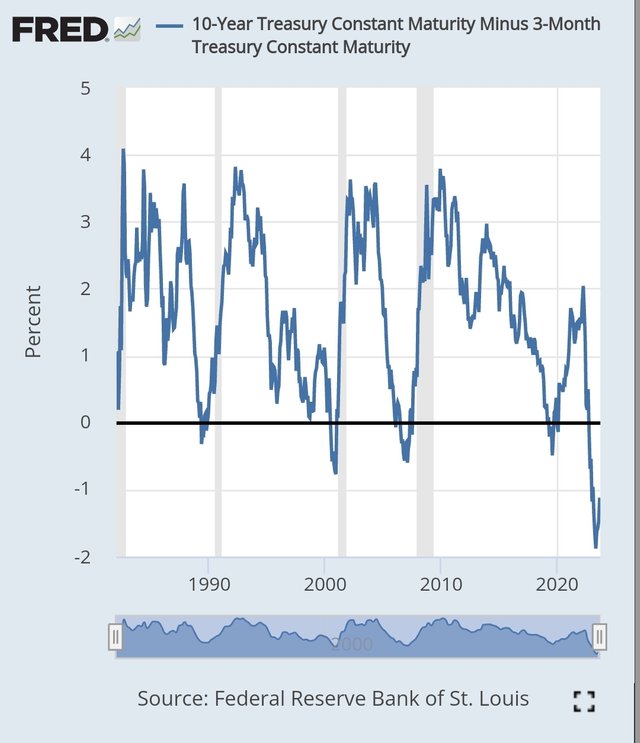
Compared to the past, 10y-3m U.S treasury yield spread inversion is the lowest. In the recent 40 years, the yield spread inversions necessarily followed recessions.
By the way, I found something in common the above chart. After the yield spread inversions peaked the lowest, and started the recovery, recessions occured some months later. It's interesting 🤔
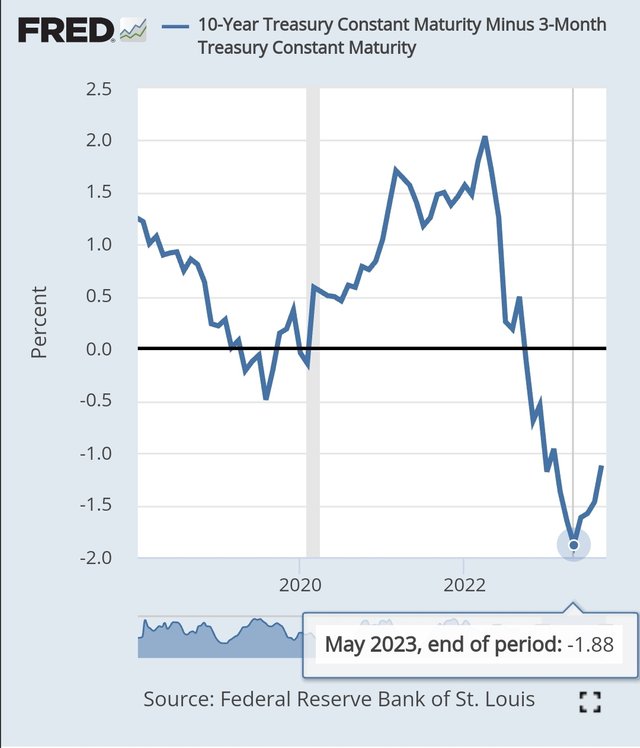
It seems that the recent ATL(All Time Low) yield spread inversion occured May 2023, and started the recovery. Therefore, there might be a next recession within some months with respect to the quantitative investment.
So, I wondered the periods between 10y-3m yield spread inversions and recessions.
7 months
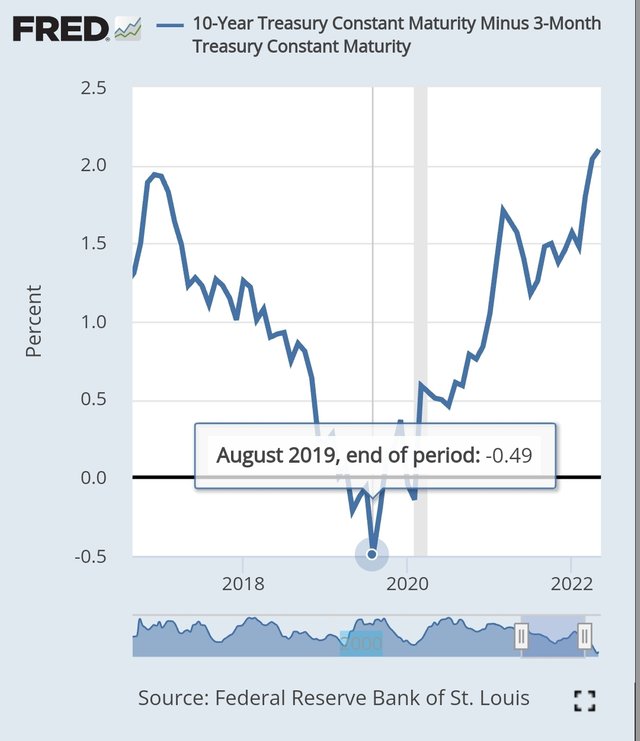
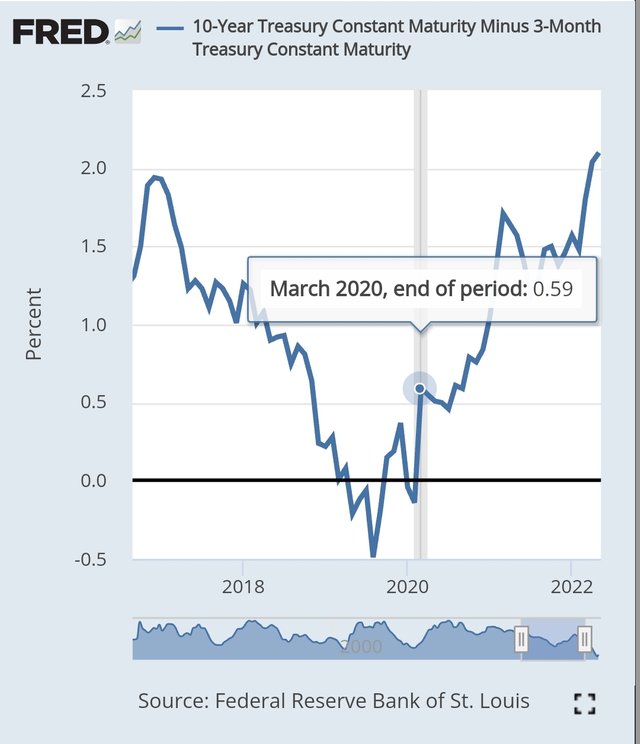
11 months
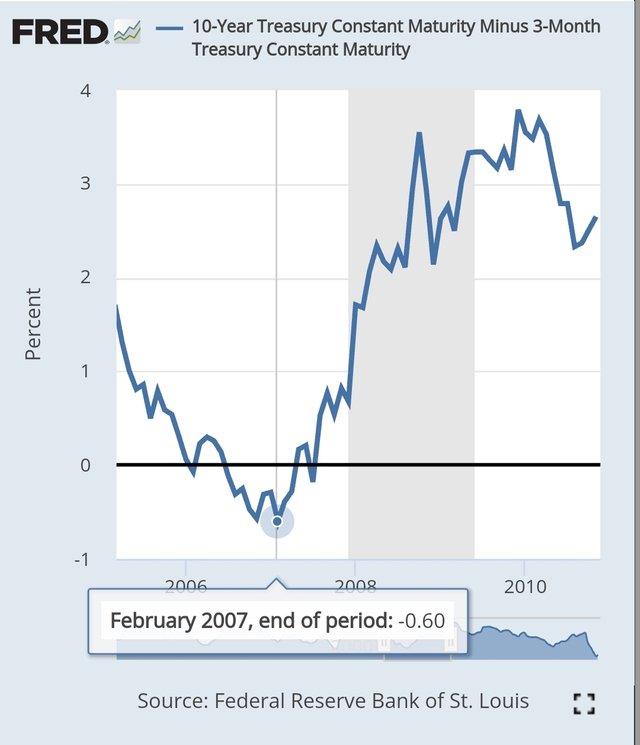
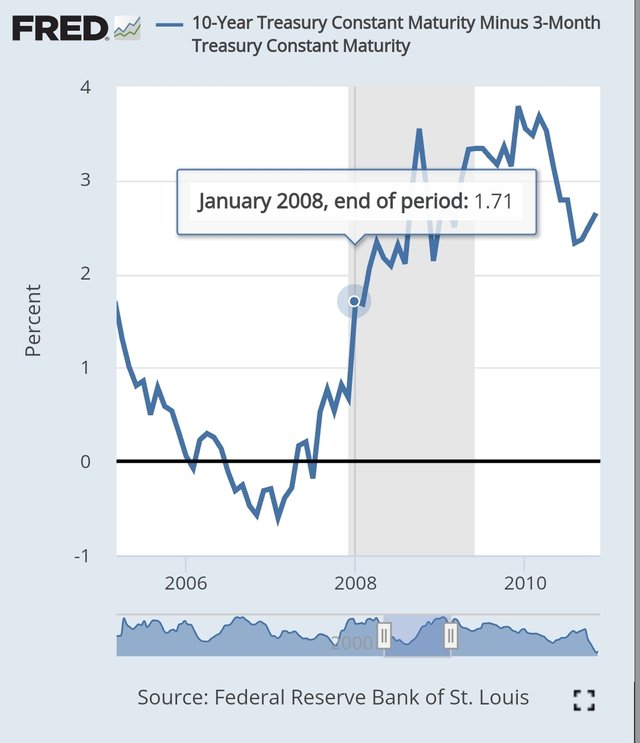
4 months
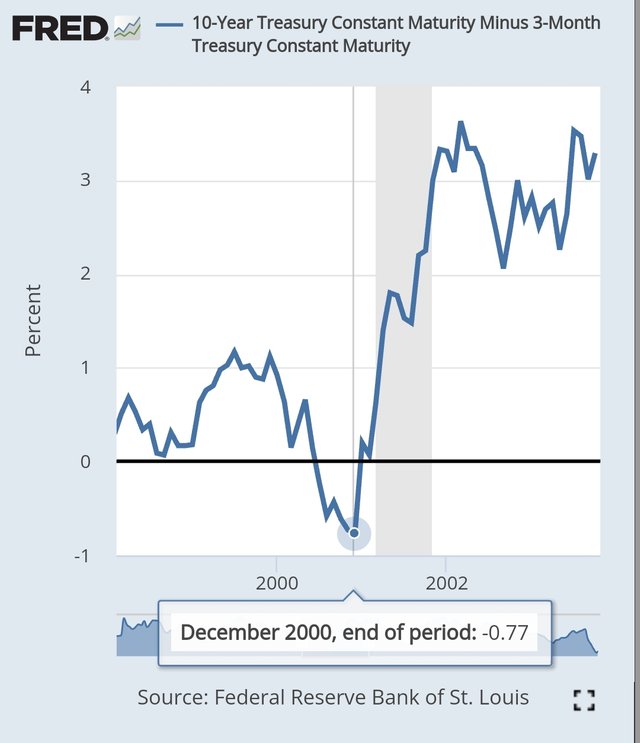
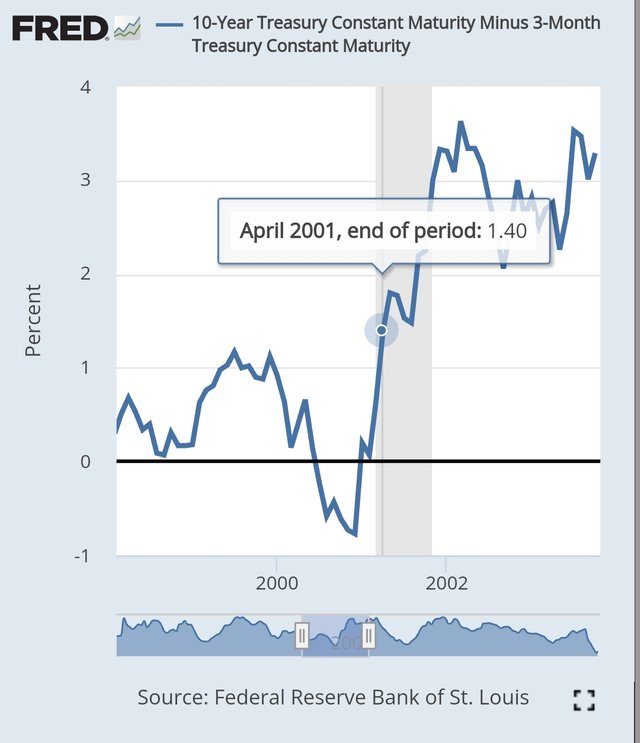
14 months
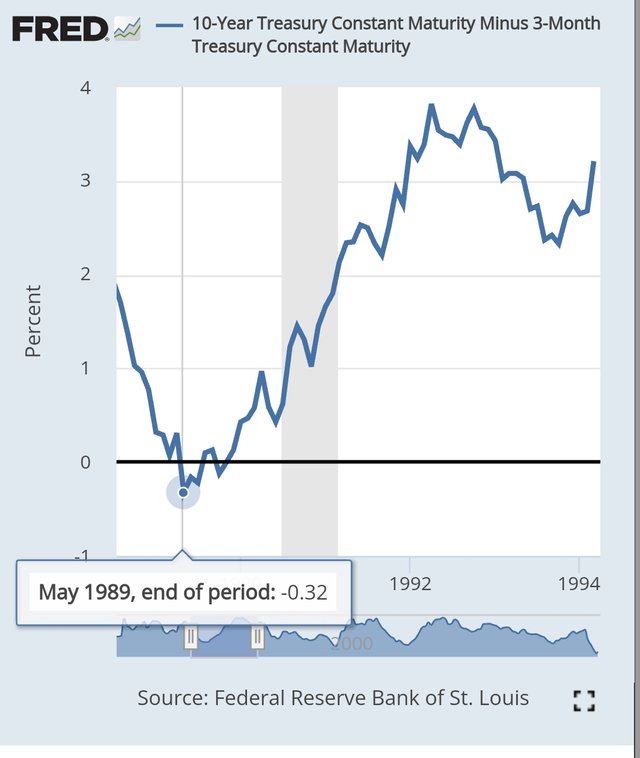
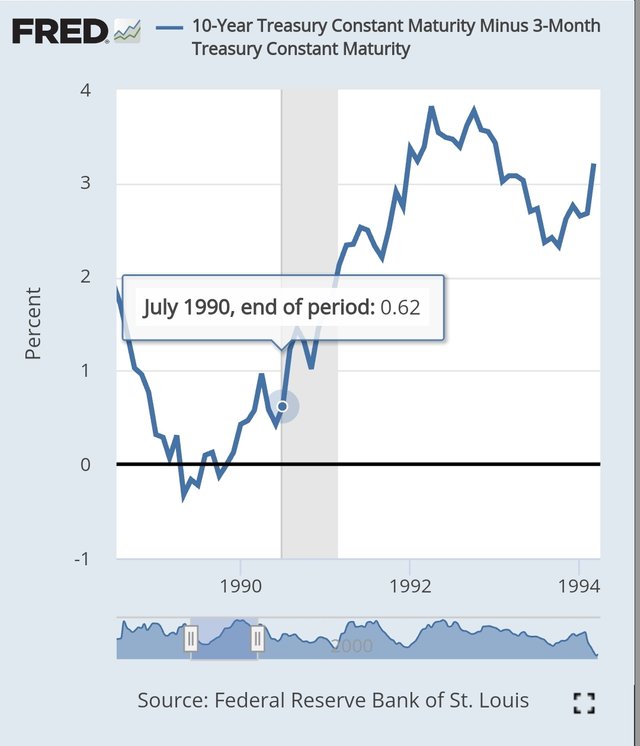
The average period between recession dates and ATL yield spread inversion is 9 months.
If the recent ATL yield spread inversion occured May 2023, the next recession could be emerging to us Feb 2024. I hope that we avoid the next recession. It's the best scenario for long-term investors.
Upvoted! Thank you for supporting witness @jswit.
Downvoting a post can decrease pending rewards and make it less visible. Common reasons:
Submit
I found it very informative content in this post.
Downvoting a post can decrease pending rewards and make it less visible. Common reasons:
Submit
Your post has been rewarded by the Seven Team.
Support partner witnesses
We are the hope!
Downvoting a post can decrease pending rewards and make it less visible. Common reasons:
Submit