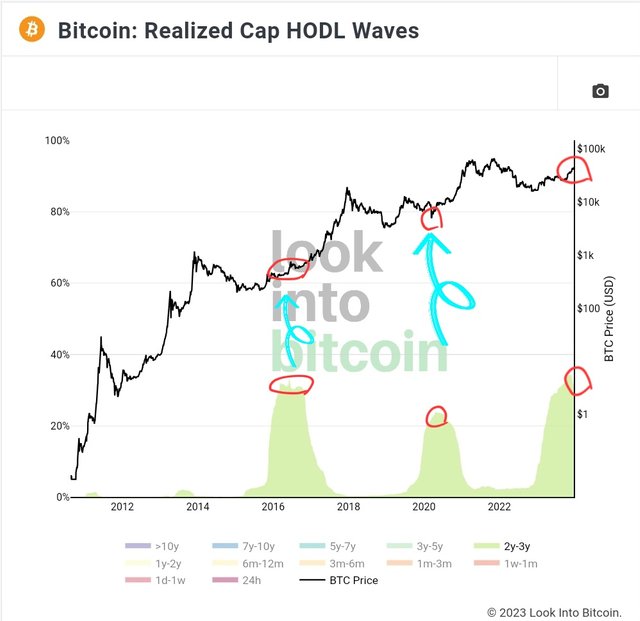
It's interesting that when the 2y-3y holder ratio was a turning point, the BTC price had either sideways or corrections. Now, it looks like the ratio reaches this cycle turning point. That means, following months will be sideways or corrections.
What is the realized cap?
Realized cap means RV(Realized Value) multiplied by in circulation. To calculate it, sum BTC prices when they were last moved. Then, take an average of them. Then, multiply by the total number of coins in circulation.
In a nutshell, Realized cap is a real inherent market cap based on the Bitcoin on-chain data.
Source 1: What can we extract trading ideas from comparing the realized cap and market cap? 🤔
Source 2: Can we extract trading ideas from Realized Cap HODL Waves?
Anyways, let's get back to this subject, when the 2y-3y holder ratio decreased from each cycycles' top, the BTC started bullish markets. However, it seems happening few months later.

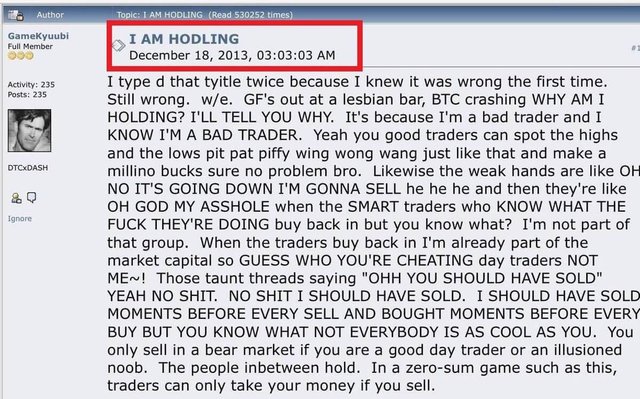
By the way, 'hodl' originated from a misspelling of 'hold' in a BitcoinTalk forum post, 2013 😂 How long have you been hodling cryptos?
This comment is for rewarding my analysis activities. Upvoting will be proceeded by @h4lab
Downvoting a post can decrease pending rewards and make it less visible. Common reasons:
Submit
拭目以待。我回调的概率大。😉
Downvoting a post can decrease pending rewards and make it less visible. Common reasons:
Submit