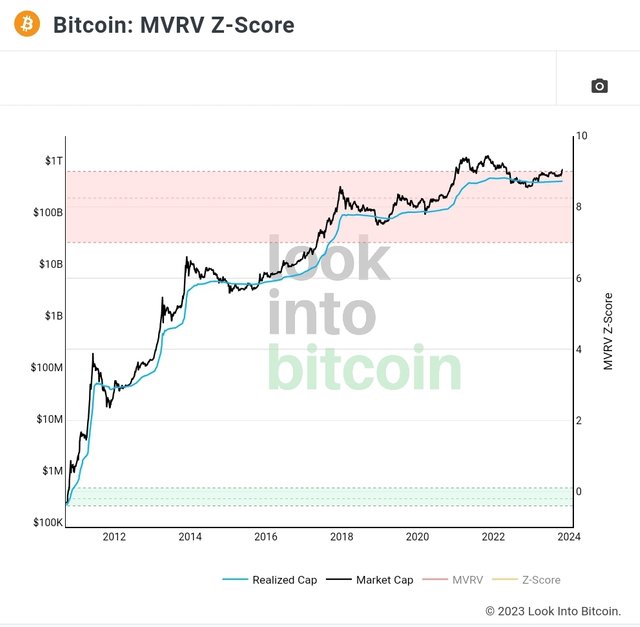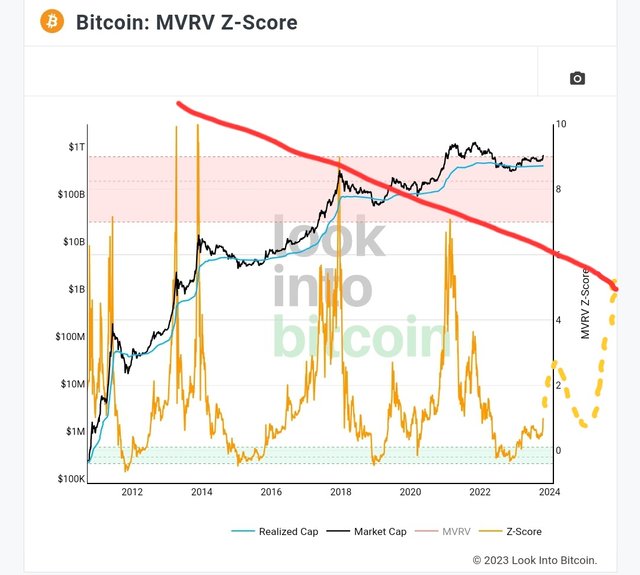
Take a look at this chart. Blue line means the Bitcoin(Hereinafter, BTC) realized capitalization(Hereinafter, cap). Black line means the BTC market cap.
Realized cap means RV(Realized Value) multiplied by in circulation. To calculate it, sum BTC prices when they were last moved. Then, take an average of them. Then, multiply by the total number of coins in circulation.
Source: Can we extract trading ideas from Realized Cap HODL Waves?
In a nutshell, Realized cap is a real inherent market cap based on the Bitcoin On-chain data.
When the realized cap was less then the market cap, BTC was undervalued. There were 5 periods such of that. Those periods were definitely good to accumulate BTC. It seems that we passed the bottom of this cycle. We might encounter a huge correction due to recessions or crypto issues such as bankruptcy of centralized exchanges or hacking of centralized exchanges or hacking of smart contracts or regulations for exchanges, etc.

I hope that we avoid those possible issues before the next BTC 4th halving date. But, my hope is just a hope. We should admit the possibility of the next correction. I think the possible scenario is we're encountering the small bullish market. Then, we would have a huge correction due to an economic issue, which means the MVRV Z score is possible to surge to 2, then, collapse to 1. Finally, we might enter this cycle bullish market after the next BTC 4th halving date.
Enjoy surfing 🏄♂️ before tsunami 🌊 Keep your eyes on 👀 the next ebb 🏖 ➡️ ⛱️ due to tsunami 🌊
Upvoted! Thank you for supporting witness @jswit.
Downvoting a post can decrease pending rewards and make it less visible. Common reasons:
Submit
what is economic issue
Downvoting a post can decrease pending rewards and make it less visible. Common reasons:
Submit