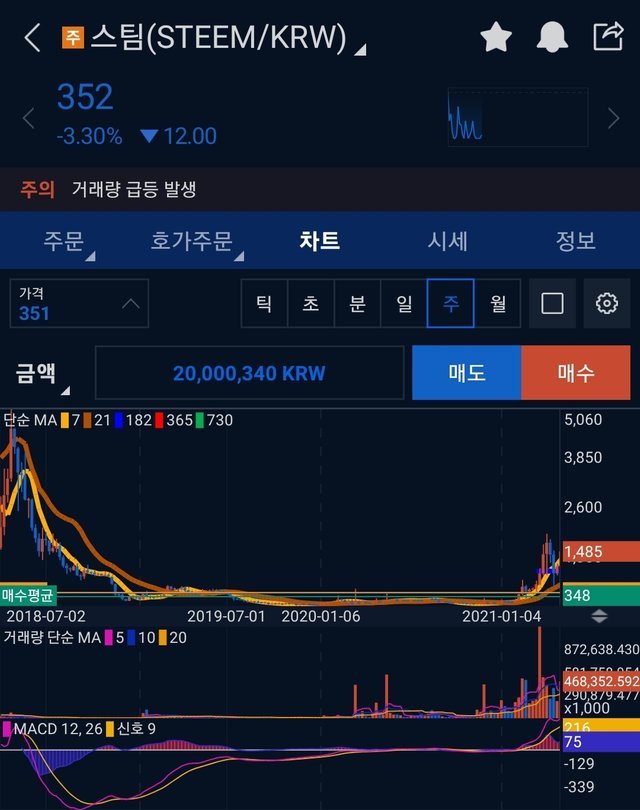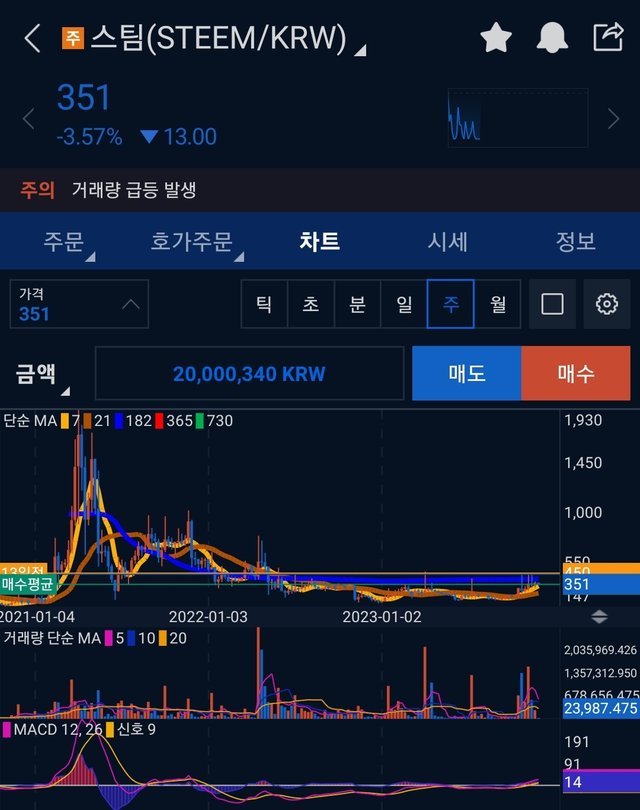
The STEEM blockchain was operated since 2016. STEEM had 2 bullish markets so far. The 1st bullish market was Jan, 2018. Then, it started collapsing until Nov 2019. It was terrible. I'd been enduring the severe bearish market. Finally, the 2nd bullish market came out from Jan 2021 to Apr 2021.
You can see that the 2nd bullish market started with the conversion of STEEM weekly MACD minus to plus.

In the recent, the STEEM weekly MACD converted minus to plus. It's a very similar condition like Jan 2021. So, that's why I'm positive of STEEM this Dec and next few weeks.