Alchemix stands out as a hybrid DeFi protocol that revolutionizes the lending landscape by introducing a unique collateralized lending mechanism. Unlike traditional DeFi protocols, Alchemix allows users to borrow against their deposited collateral, generating yield in the process. This innovative approach enables users to maximize their capital efficiency and access liquidity without selling their assets.
Technical Analysis: Uncovering Price Patterns and Potential Opportunities
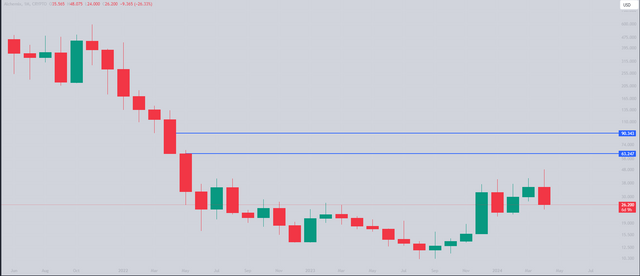
Monthly Chart: Base Formation and Anticipating an Uptrend

The monthly chart reveals a four-month period of base formation, with price action confined within a well-defined range. This consolidation phase suggests a potential breakout and an upward trajectory once the range is breached.
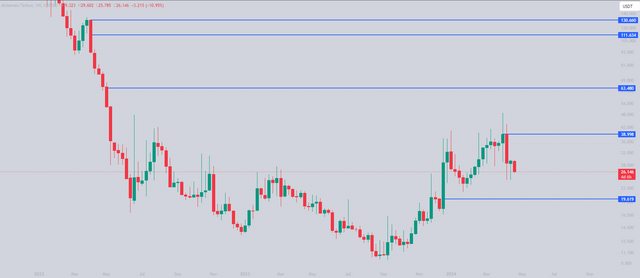
Weekly Chart: Healthy Correction and Awaiting Bottom Confirmation

Following a healthy correction, the weekly chart indicates that bottom confirmation is yet to occur. This suggests a continuation of the ranging pattern, with a range low of $23 and a range high of $38. This presents an opportunity for accumulation in anticipation of future price appreciation, potentially reaching $111 to $130.
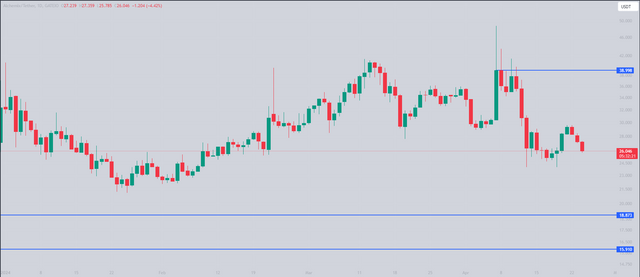
Daily Chart: Impulsive Movements and Potential Retest

The daily chart presents current trading at $26.122, with impulsive price movements evident. Two consecutive low candles suggest a potential upward move followed by a retracement. Additionally, an imbalance zone exists between $15 and $18, indicating a potential target for a price retest.
Disclaimer
It is crucial to emphasize that this analysis is solely intended for educational purposes and does not constitute financial advice. Any investment decisions based on this information are at your own discretion and risk.