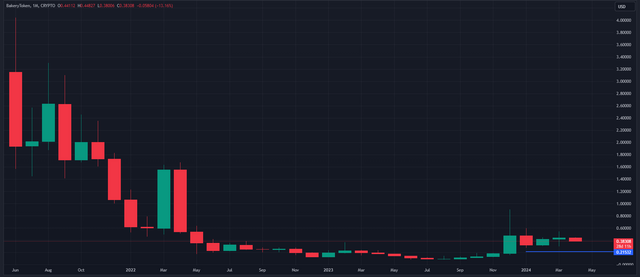
Today, let's analyze the Bakeryswap token (BAKE) and observe its market trends. Firstly, let's open the monthly chart. Over the past five months, we can see a convergence of red and green candles on the monthly chart, indicating a price movement towards the upside. Although there was a slight downturn in January, since then, the price has been consistently shifting upwards. This month has just begun, and until bearish movements occur, I anticipate all candles to be green. If they do, the market could touch $0.215. From a longer timeframe perspective, I'm expecting a good return from this.

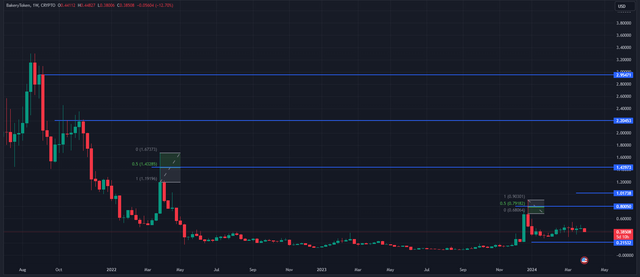
To determine potential returns and market movements, I'm looking at the weekly timeframe. It appears to be in a ranging movement currently, with an accumulation zone. From here, I expect it to reach up to $2.95. For understanding how the market might move, I'm focusing on the daily timeframe.

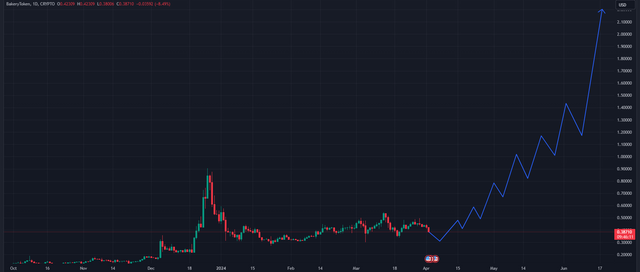
On the daily timeframe, we see that the market is undergoing a slight correction. It could correct in steps of 0.5, 0.6, 0.8, 1.0, 1.4, and up to 2.2. Now the question arises: where should we enter?

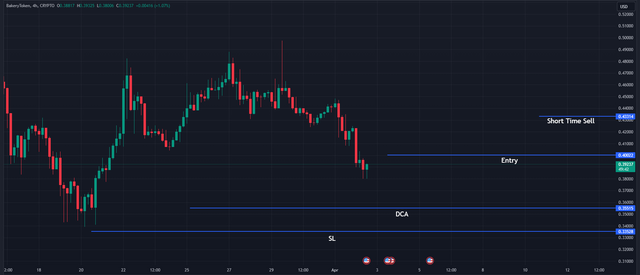
For entry points, I've opened the four-hour chart. Here, there's a possibility of an SFP (swing failure pattern) around 0.38. If it confirms, meaning a green candle crosses above 0.39, then we should enter at 0.40. The Dollar-Cost Averaging (DCA) point would be at 0.355, with a Stop Loss (SL) set at 0.335.