The Internet Computer Protocol (ICP) stands out as a blockchain aiming to revolutionize traditional IT infrastructure by offering a decentralized alternative. It leverages blockchain technology to provide scalable smart contract computations, promising operation at internet speeds with infinite capacity.
Technical Analysis: Examining ICP's Price Trends
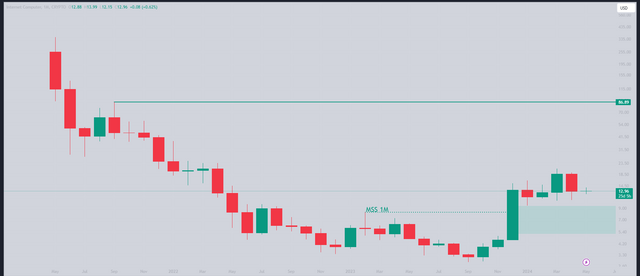
Monthly Chart: Confirmed Market Structure Shift and Baseline Formation

The monthly price chart for ICP suggests a confirmed market structure shift at the $8.26 level. Currently, the price is trading above this level and establishing a baseline between $9.56 and $15.
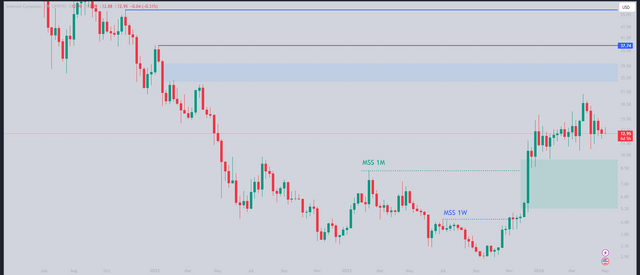
Weekly Chart: Ranging Movement

The weekly chart indicates that ICP has been trading within a range for the past few weeks, with a range high of $15.6 and a range low of $12.
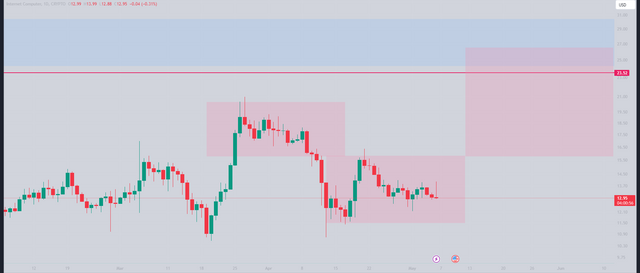
Daily Chart: Potential Manipulation Zone and Price Movement

The daily chart suggests that ICP might be within a manipulation zone. This indicates the price action could potentially revisit the Point of Control 3 (POC 3), which translates to the price potentially retesting the support level around $10.93 two or three times before a potential bullish breakout with a deviation from this level.
Disclaimer
It's crucial to emphasize that this analysis is for educational purposes only and shouldn't be considered financial advice. Investment decisions based on this information are at your own risk and discretion.